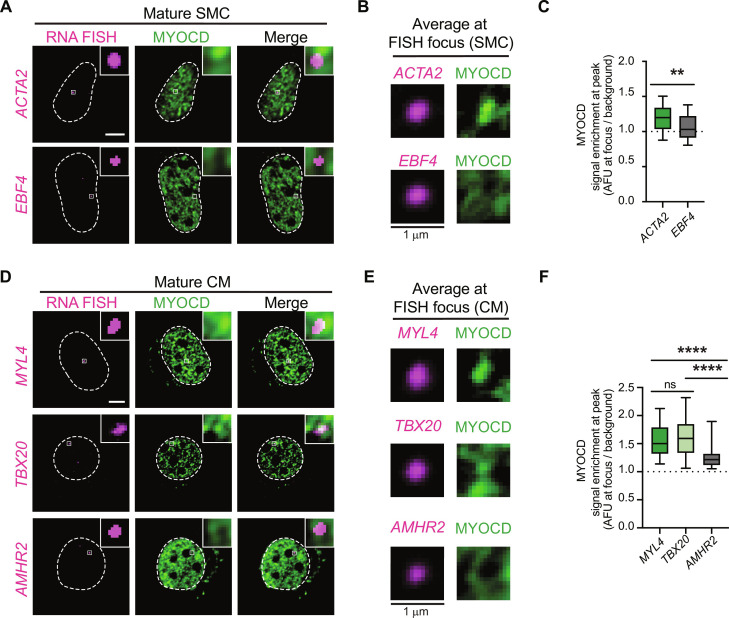
Fig. 3. MYOCD condensates are sites of cell identity gene transcription.
(A) RNA FISH and IF in mature SMC nuclei for indicated nascent transcript (magenta) and MYOCD (GFP). Square box denotes location of crop shown in top right. Scale bar, 5 μm. (B) Average signal of indicated nascent transcript (magenta) or MYOCD (GFP) centered on the nascent transcript focus (1.5 μm2) in SMC. n ~ 25. (C) Boxplot (mean ± 10 to 90%) showing enrichment of MYOCD at either the center of the nascent transcript foci or at random sites in SMCs. P values represent results of t test followed (P values: **P ≤ 0.01). (D) RNA FISH and IF in mature CM nuclei for RNA of indicated transcript (magenta) and MYOCD (GFP). Square box denotes location of crop shown in top right. Scale bar, 5 μm. (E) Average signal of indicated nascent transcript (magenta) or MYOCD (GFP) centered on the nascent transcript focus (1.5 μm2) in CM. n ~ 25. (F) Boxplot (mean ± 10 to 90%) showing enrichment of MYOCD either at the center of the nascent transcript foci or at random sites in CMs. P values represent results of Kruskal-Wallis test followed by Dunn’s test for multiple comparisons (P values: ns P > 0.05, ****P ≤ 0.0001).

