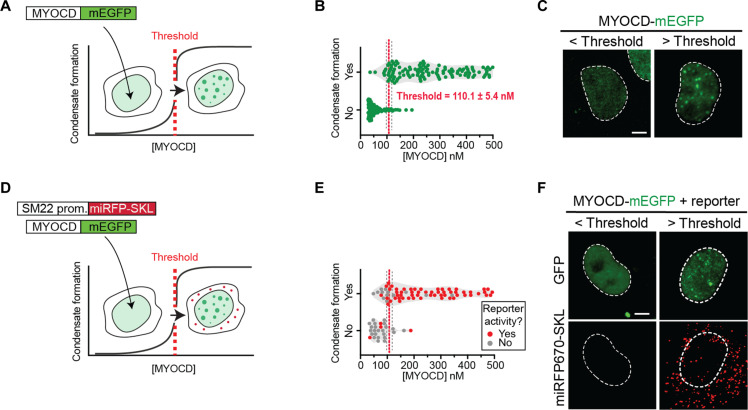
Fig. 4. Formation of MYOCD condensates activates reporter gene expression.
(A) Schematic showing that MYOCD-mEGFP forms nuclear condensates (green) in COS-7 cells in a concentration-dependent manner. (B) Violin plot of MYOCD concentration and condensate formation in COS-7 cells where each dot represents one nucleus. Threshold is determined by a simple logarithmic regression analysis and represented by X at 50% ± SD. P values from t test, ****P ≤ 0.0001. Five biological replicates total. n = 292. (C) Representative micrographs (max projections) of COS-7 cells expressing MYOCD-mEGFP below or above the critical concentration threshold demonstrated in (B). Scale bar, 5 μm. (D) Schematic showing that the formation of condensates (green) is coupled to the expression of the SM22 promoter-driven fluorescent reporter trafficked to peroxisomes (miRFP670-SKL, red). (E) Violin plot of MYOCD concentration and condensate formation where each dot represents one nucleus. Cells expressing reporter shown in red and cells not expressing reporter shown in gray. n = 48. (F) Representative micrographs (max projections) of COS-7 cells expressing MYOCD-mEGFP below or above the critical concentration threshold showing either MYOCD (GFP) or the fluorescent reporter (miRFP670-SKL, shown in red). Brightness and contrast of displayed micrographs are equivalent unless otherwise stated. Scale bar, 5 μm.

