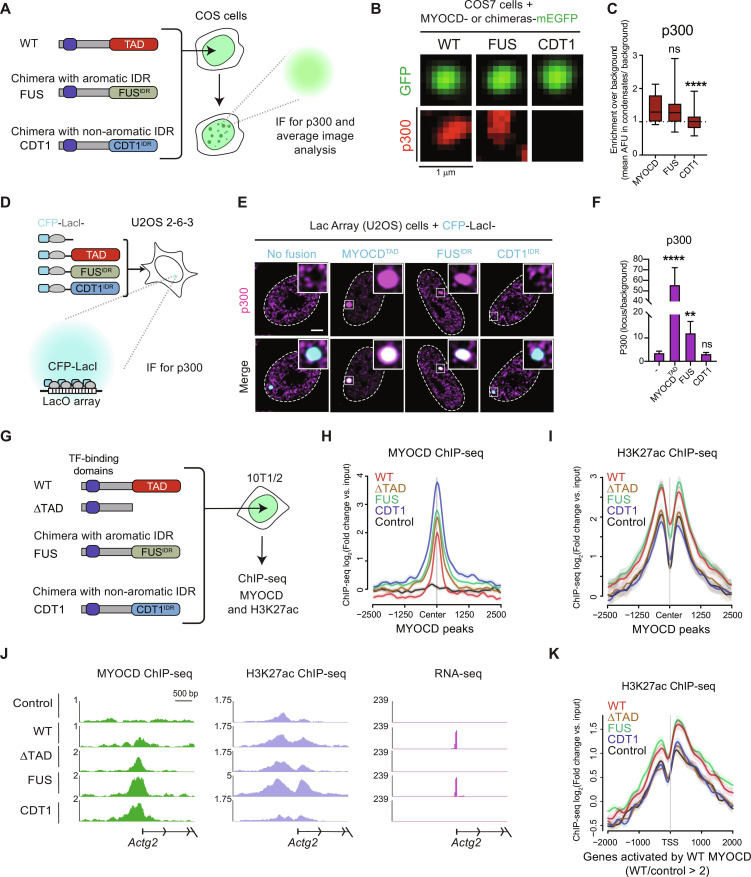
Fig. 7. Condensates formed by MYOCD TAD domain and FUS-IDR selectively partition the histone acetyltransferase p300, but CDT1-IDR does not.
(A) Schematic of experimental design for colocalization of p300 in MYOCD condensates. (B) Average projection of WT MYOCD or chimeric condensates in COS-7 cells with IF for endogenous p300. Scale bar, 1 μm. (C) Box plot (10 to 90%) displaying the enrichment of p300 at the center of the MYOCD condensates normalized to background intensity. P value is from one-way ANOVA with Dunnett’s multiple comparison test (P values: ns P > 0.05, ***P ≤ 0.001, ****P ≤ 0.0001). n ~ 25. (D) Schematic of Lac array cells. (E) IF for p300 (magenta) in Lac array cells expressing indicated CFP-LacI fusion. Inset is LacO locus (white shows magenta and cyan overlap). Scale bar, 5 μm. (F) IF bar chart (mean ± SD) quantifying enrichment of p300 at CFP-LacI (no fusion) or CFP-LacI with fusion (x-axis label). P values from one-way ANOVA with Dunnett’s test. (P values: ns P > 0.05, **P ≤ 0.01, ****P ≤ 0.0001). n = 22. (G) Schematic of experimental design for ChIP-seq in reprogrammed 10T1/2 cells. (H) Metagene plot of the log2fold change compared to input control of MYOCD occupancy centered on WT MYOCD peaks compared to the empty vector control. (I) Metagene plot of the log2fold change compared to input control of H3K27ac occupancy centered on WT MYOCD peaks compared to the empty vector control. (J) Gene tracks of MYOCD and H3K27ac ChIP-seq and RNA-seq from differentiated 10T1/2 cells expressing the indicated constructs at Actg2 locus. (K) Metagene plot of the log2fold change compared to input control of H3K27ac occupancy centered on the TSS of genes activated by WT MYOCD.

