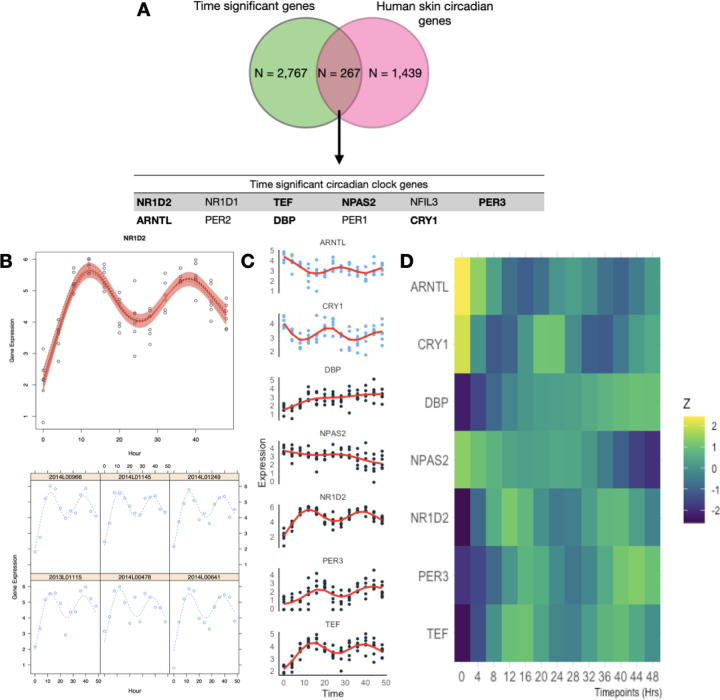
Figure 2. Expression patterns and mixed non-linear modeling of circadian genes.
A. Overlap of the genes that were found to have a significant effect of time in their expression as well as being previously identified as circadian within the skin tissue (Del Olmo et al. 2022). In bold are those genes that displayed expression patterns consistent with circadian rhythms. B. Example of smoothing-splines mixed-effect model of the genes that displayed circadian oscillations and their known redundant gene partners. The red area indicates the 95 percent confidence interval. Gene expression values are presented as lCPM (log of counts per million) C. Dynamic time warp clustering results of the 9 circadian clock genes identified in this in vitro model. Due to the differences in magnitude of gene expression across circadian genes, expression values were z-scored. Clustering results for all 267 genes can be found in the supplementary material.

