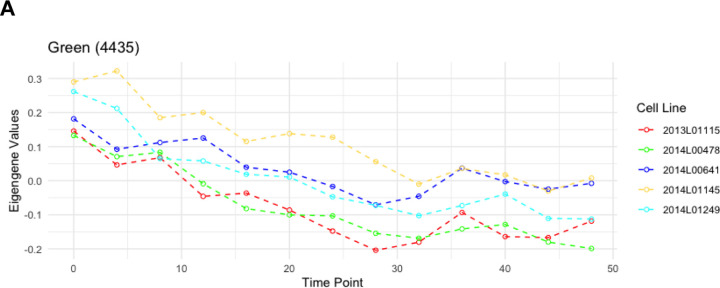
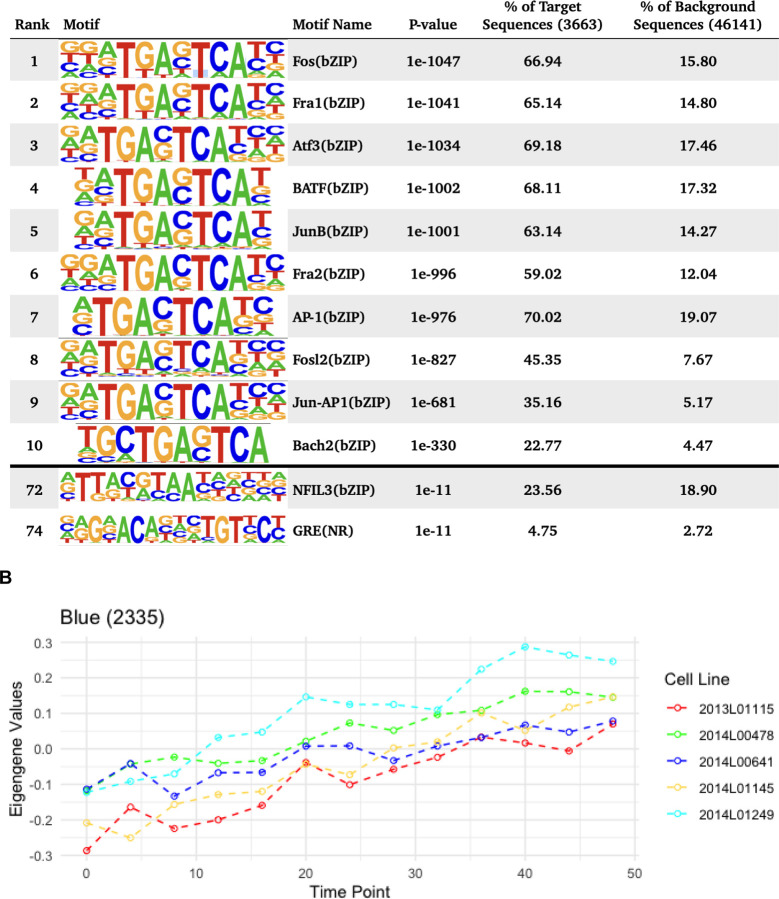
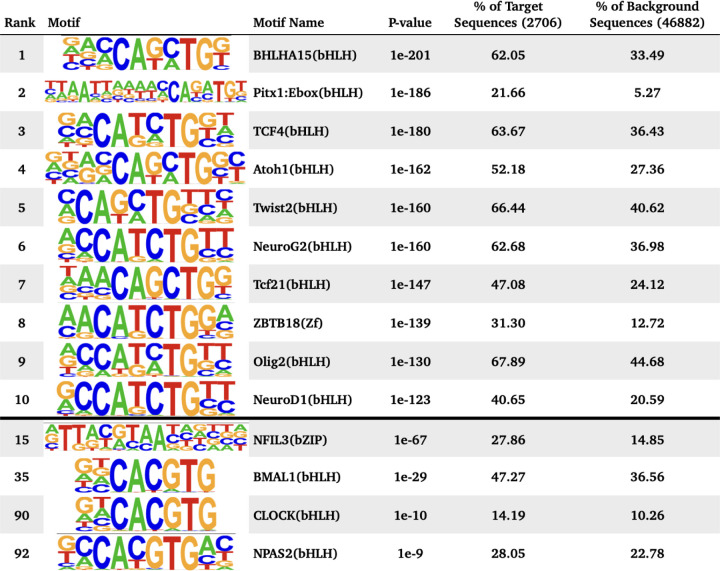
Figure 3. Motif enrichment analysis of time significant peak regions.
Motif enrichment analysis results after combining all open chromatin regions that followed a similar change in accessibility over time, including the top 10 motifs as well as motifs associated with circadian genes and glucocorticoid response. P-values were confirmed as significant after the Benjamini adjustment cutoff of 1% FDR. A. Eigengene values for the Green WGCNA module and motif enrichment analysis of the associated decreasing in accessibility regions. B. Eigengene values for the Blue module and motif enrichment analysis of the associated peak regions, including HOMER results for all peak regions decreasing in accessibility.


