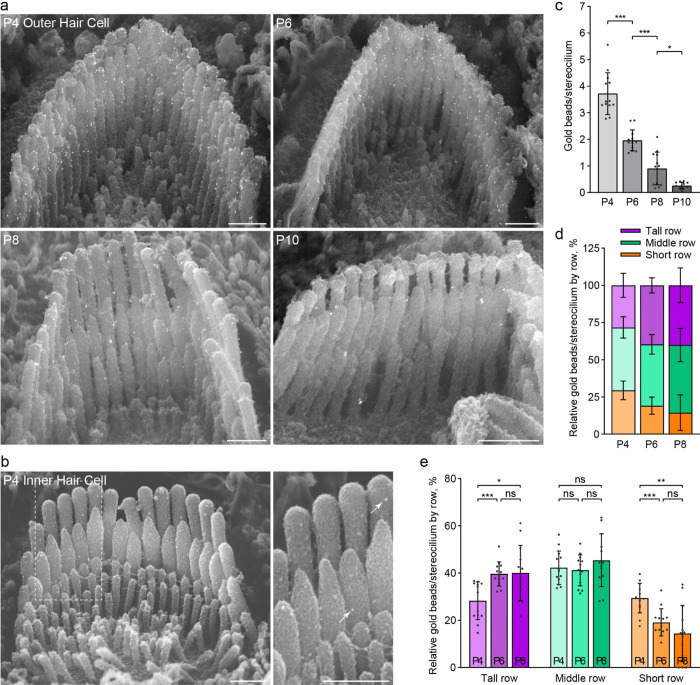
Figure 3. The distribution of anti-PKHD1L1 immunogold labels on the surface of OHC bundles does not change during development.
a, Anti-PKHD1L1 immunogold SEM of OHC bundles in the mid/basal region at P4, P6, P8 and P10. b, P4 IHC bundles are labeled with fewer gold beads (arrows), as compared to OHCs. Scale bars, 500 nm. c, Quantification of the total number of gold beads per OHC stereocilium show a gradual decrease of labeling density, with most of the labeling gone by P10. Statistical analysis, one-way ANOVA with Sidak’s multiple comparison tests between consecutive time points. d, e, Distribution of gold beads at the surface of the tallest, middle, and short rows of stereocilia as a portion of the total number of gold beads per bundle, normalized per stereocilium. A slight increase in the proportion of gold beads in the tallest row, and a reduction in the proportion of gold beads in the shortest row, is observed between P4 and P6. Statistical analysis, two-way ANOVA with matched design between stereocilia rows from the same cell. Tukey’s multiple comparison tests are shown between time points for each row. * p<0.05, ** p<0.01, *** p<0.001. All results are presented as mean ± SD, datapoints represent individual cells (n=13 at each time point).

