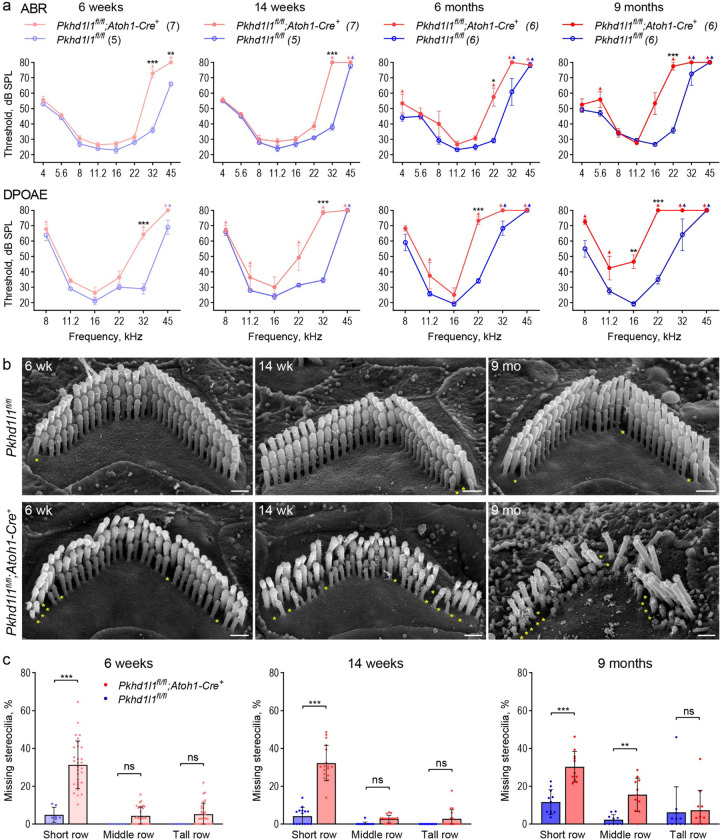
Figure 6. PKHD1L1-deficient mice display progressive hearing loss and stereocilia disruption.
a, ABR and DPOAE of Pkhd1l1fl/fl::Atoh1-Cre+ and Pkhd1l1fl/fl::Atoh1-Cre− mice show progressive high-frequency hearing loss in PKHD1L1-deficient mice as early as 6 weeks. Data are shown as mean ± SEM. Up-arrows indicate that at the highest SPL level tested (80 dB SPL), at least one mouse in the group had no detectable thresholds at that frequency. Statistical analysis, two-way ANOVA with matched design between frequencies from the same mouse. Sidak’s multiple comparison tests are shown between genotypes for each frequency. b, SEM of OHC stereocilia bundles at 6 weeks, 14 weeks, and 9 months in the basal region (32 kHz) reveal progressive stereocilia loss (asterisks) and bundle disorganization. Scale bars, 500 nm. c, Quantification of missing stereocilia in OHC bundles in the basal turn (32 kHz region) of the cochlea, presented as percentage of stereocilia missing per row. There is a greater stereocilia loss in Pkhd1l1fl/fl::Atoh1-Cre+ mice as compared to their Pkhd1l1fl/fl::Atoh1-Cre− littermates at all age points. Data displayed as mean ± SD, points represent individual cells (see n in Methods). Statistical analysis, two-way ANOVA with matched design between rows from the same cell. Sidak’s multiple comparison tests are shown between rows for each genotype. *p<0.05, **p<0.01, ***p<0.001.

