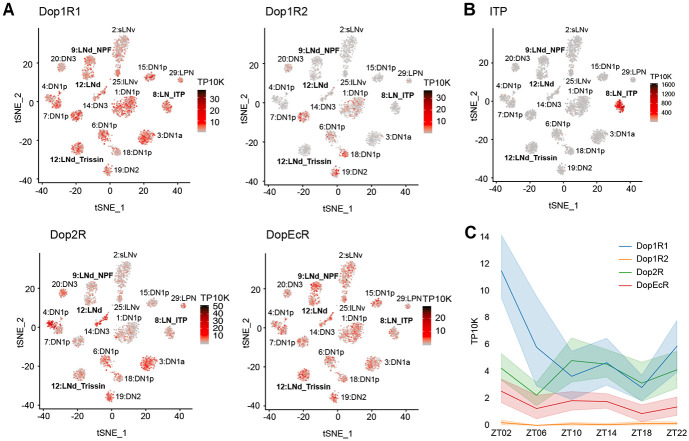
Figure 4. ITP+ LNs highly express Dop1R1 mRNA.
(A) Single-cell RNA sequencing data of circadian neurons13 displayed as tSNE plots and shaded by levels of dopamine receptor mRNA expression in number of transcripts per ten thousand transcripts. Each dot represents a single cell and each cluster represents a cell-type. Evening cell clusters marked by bold text.
(B) Single-cell RNA sequencing data of circadian neurons13 displayed as a tSNE plot and shaded by levels of ITP mRNA expression in number of transcripts per ten thousand transcripts. Each dot represents a single cell and each cluster represents a cell-type. Evening cell clusters marked by bold text.
(C) Timeseries plot of dopamine receptor mRNA expression levels around the clock in ITP+ LNs in number of transcripts per ten thousand transcripts. Different colors represent different dopamine receptors mRNAs. Bold lines are means and shaded regions are 95% confidence intervals of the means.

