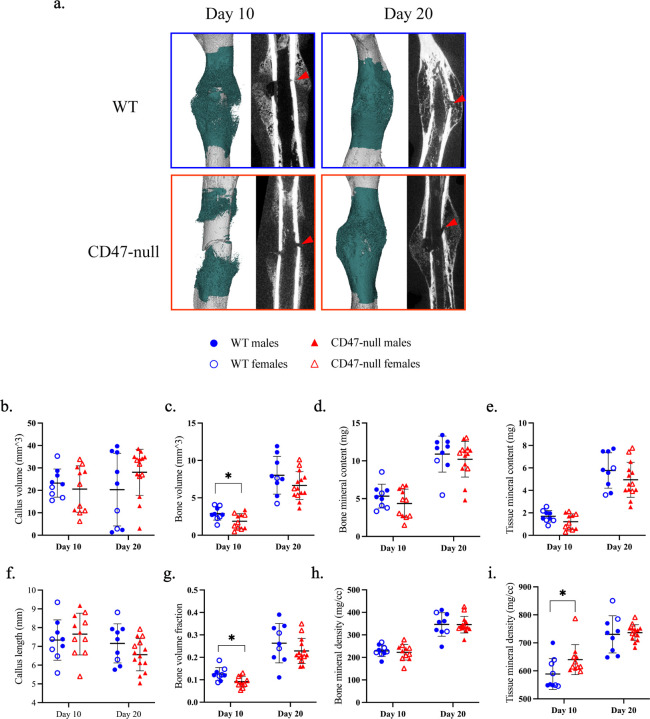
Figure 1. CD47-null fractures show reduced bone formation, but increased tissue mineral density.
µCT analysis of transverse femoral fracture in WT (n=9) and CD47-null (n=11–14) mice at 10- and 20-days post-fracture. a, Representative 3D reconstructions (white background) and sagittal-plane reconstruction (black background) of WT and CD47-null mice at days 10 and 20 post-fracture. Location of fracture (red arrowhead) is marked on the sagittal reconstructions. Representative 3D reconstructions include callus mineralization (teal). b-i, Callus morphology (mean±SD) at day 10 and 20 post-fracture. *P<0.05, two-sided t test performed at each timepoint.

