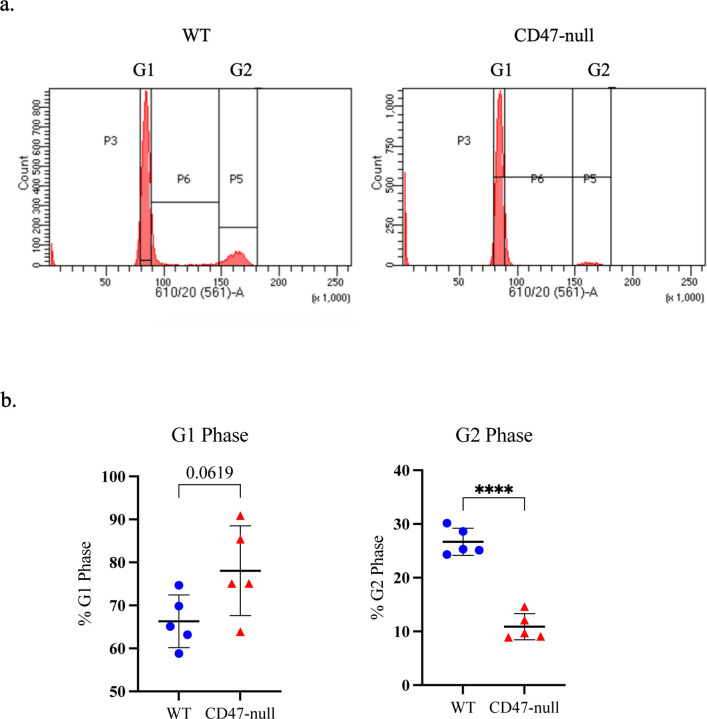
Figure 4. Loss of CD47 decreases percent of MSC in S/G2 phase.
Cell cycle analysis of marrow-derived MSC harvested from the femur and tibia of WT (n=5) and D47-null (n=5) mice. a, Representative histograms of WT (left) and CD47-null (right) with cell cycle analysis overlays b, Percent of cells in G1 phase or S/G2. Mean ±SD, *P<0.05, **P<0.01, ***P<0.001, two-sided t test.

