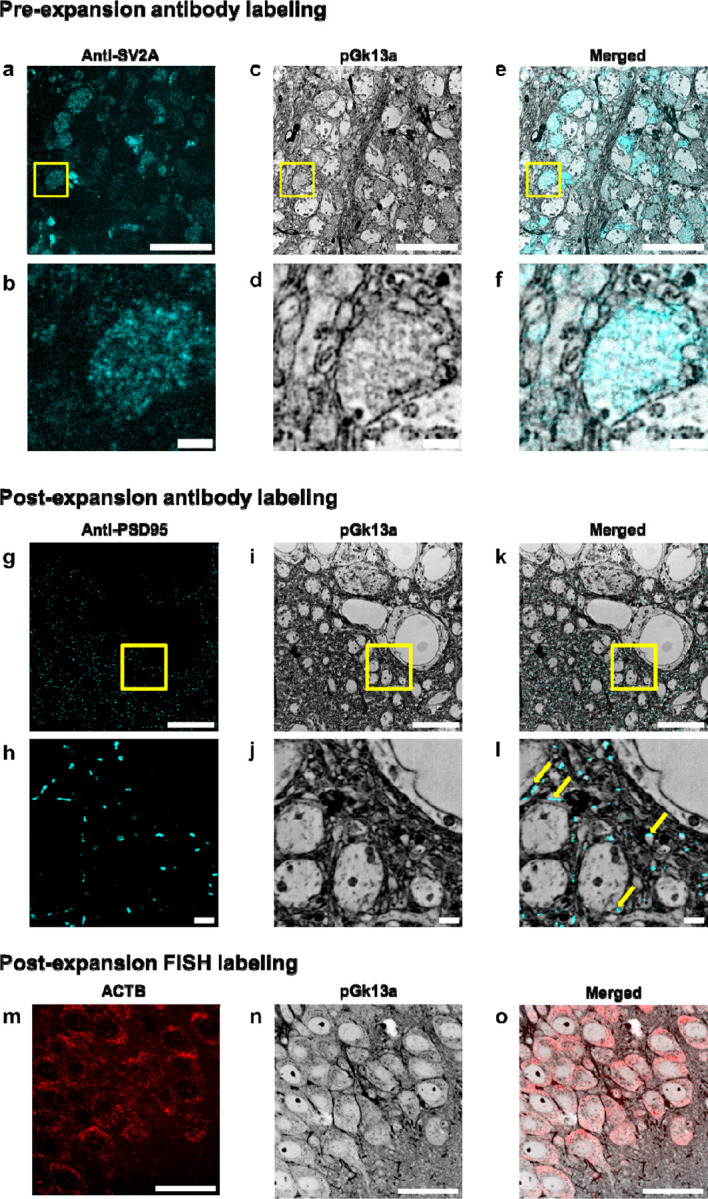
Figure 3. umExM with antibody staining and RNA fluorescence in situ hybridization (FISH).

(a) Representative (n=5 slices of fixed brain from two mice) single z-plane confocal image of expanded mouse brain tissue (hippocampus, CA3) after umExM processing with a pre-expansion antibody staining protocol (Supp. Fig. 16), showing immunostaining with an antibody against the synaptic vesicle protein SV2A. (b) Magnified view of the yellow box in (a). (c) Single z-plane confocal image of the specimen of (a), showing pGk13a staining of the same field of view as in (a). pGk13a staining of the membrane visualized in inverted gray color throughout this figure. (d) Magnified view of the yellow box in (c). (e) Overlay of (a) and (c). (f) Magnified view of the yellow box in (e). (g) Representative (n=5 slices of fixed brain from two mice) single z-plane confocal image of expanded mouse brain tissue (hippocampus, CA1) after umExM processing with a post-expansion antibody staining protocol (Supp. Fig. 17), showing immunostaining against the post-synaptic density protein PSD-95. (h) Magnified view of the yellow box in (g). (i) Single z-plane confocal image of the specimen of (g), showing pGk13a staining of the same field of view as in (g). (j) Magnified view of the yellow box in (i). (k) Overlay of (g) and (i). (l) magnified view of the yellow box in (c). The examples of PSD95 signals that were aligned with pGk13a signals were pinpointed with yellow arrows. (m) Representative (n=3 slices of fixed brain from one mouse) single z-plane confocal image of expanded mouse brain tissue (hippocampus, CA1) after umExM processing with a FISH protocol (Supp. Fig. 19), showing HCR-FISH targeting ACTB. (n) Single z-plane confocal image of the specimen of (j), showing pGk13a staining of the same field of view as in (j). (o) Overlay of (m) and (n). Scale bars: (a,b,c,g,h,j) 5 μm, (d,e,f,j,k,l) 1μm, (m, n, o) 20 μm.
