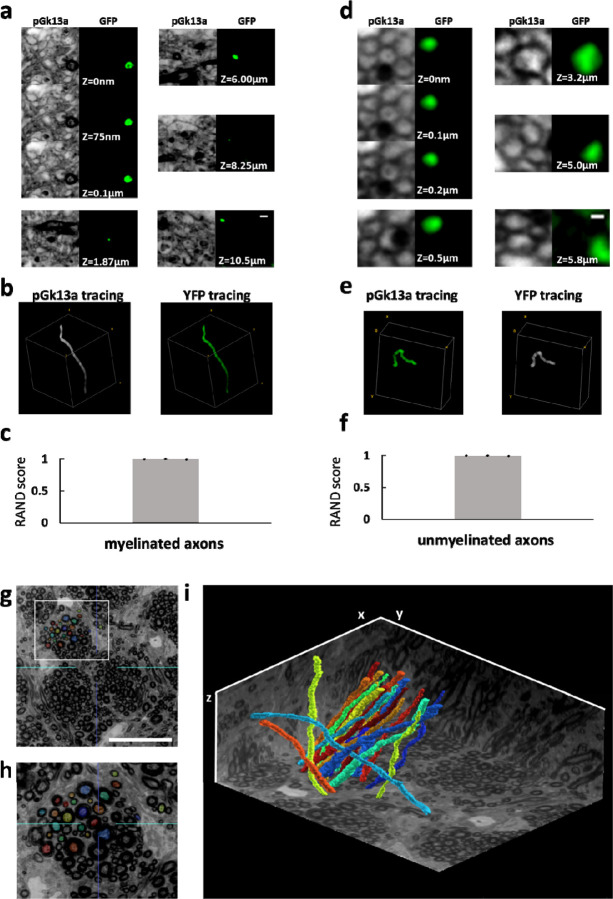
Figure 5. Traceability of umExM.
(a) (pGk13a column) Serial confocal images of expanded Thy1-YFP mouse brain tissue after umExM processing, showing pGk13a staining of the membrane. (GFP column) anti-GFP signal of the same sample in the same field of view. (b) (left) pGk13a signal-guided manually traced and reconstructed myelinated axon from (a, pGk13a column). (right) As in (left), but with anti-GFP signals. (c) Rand score (n=3 myelinated axons from two fixed brain slices from two mice) of pGk13a signal-guided manual tracing of myelinated axons, using anti-GFP signal-guided tracing as a “ground truth.” (d) As in (a) but with an unmyelinated axon. (e) As in (b) but for (d). (f) As in (c) but for unmyelinated axons (n=3 unmyelinated axons from two fixed brain slices from two mice). (g) Representative (n=4 fixed brain slices from two mice) single z-plane confocal image of expanded mouse brain tissue (corpus callosum) after umExM with double gelation processing (Supp. Fig. 21), showing pGk13a staining of the membrane. The seeding points for manual segmentation are labeled with colors. (h) Magnified view of the white box in (g). (i) 3D rendering of 20 manually traced and reconstructed myelinated axons in the corpus callosum. Planes were visualized from raw umExM images that were used for tracing. Scale bars: (a) 0.5μm, (d) 0.2μm, (g) 18μm, (i) 39.25μm (x); 39.25μm (y); and 20μm (z)

