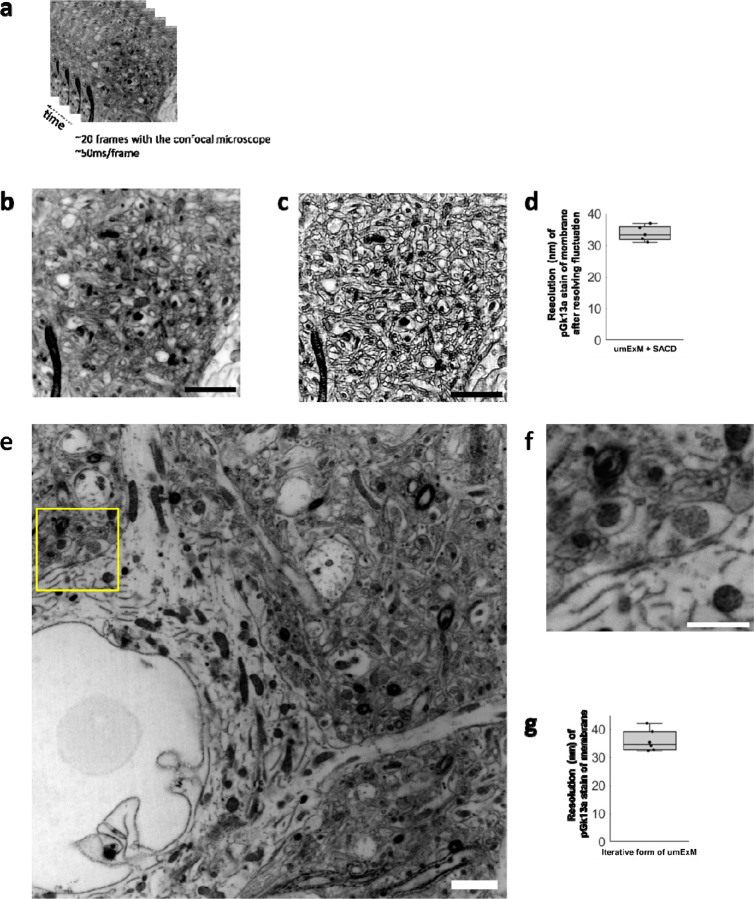
Figure 6. Higher resolution umExM.
(a) Representative (n=5 fixed brain slices from 2 mice) single z-plane confocal image of post-expansion mouse brain tissue (Somatosensory cortex, L4) that underwent the umExM protocol. Images were taken at 50ms/frame for 20 frames with a confocal microscope with 1.5x optical zoom. pGk13a staining of the membrane visualized in inverted gray color throughout this figure. (b) Average z-projection of images in (a). (c) Fluctuations in the acquired frames (as in (a)) were resolved with the ‘super-resolution imaging based on autocorrelation with a two-step deconvolution’ (SACD) algorithm48. (d) Boxplot showing resolution of post-expansion confocal images (60x, 1.27NA objective) of umExM + SACD-processed mice brain tissue slices showing pGk13a staining of the membrane (n=5 fixed brain slices from two mice). (e) Representative (n=6 fixed brain slices from one mouse) single z-plane confocal image of post-expansion mouse brain tissue (Somatosensory cortex, L4) after the iterative form of umExM processing (Supp. Fig. 22), showing pGk13a staining of the membrane. (f) Magnified view of yellow box in (e). (g) as in (d) but for the iterative form of umExM (n=6 fixed brain slices from one mouse). Scale bars: (b-c) 10μm, (e-f) 1.5μm

