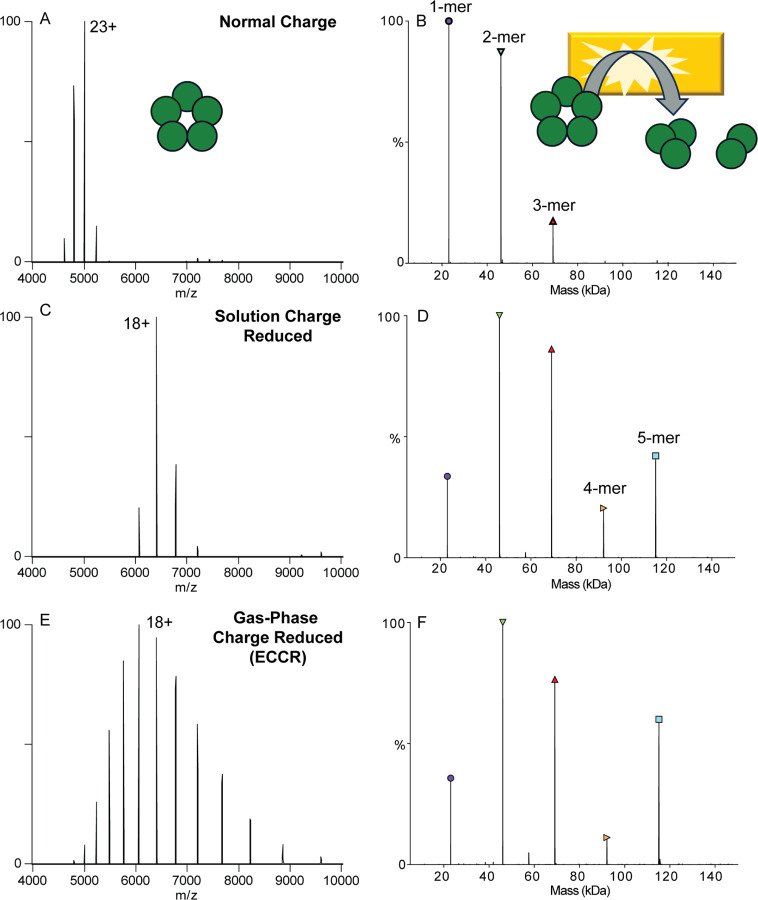
Figure 3.
Comparison of C-reactive protein MS and SID patterns for A&B) normal charge (acquired in ammonium acetate), C&D) solution charge reduced (acquired with an 80:20 ratio of ammonium acetate to triethylammonium acetate) E&F) gas-phase charge reduced (ECCR). Acquired with in-source trapping −30 V, and SID voltage of 40 V (normal charge) or 60 V (solution phase and gas-phase charge reduced).

