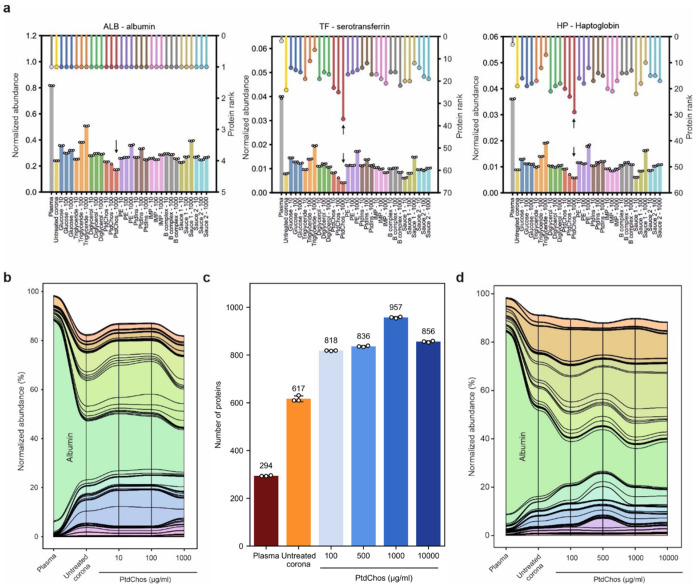
Fig. 2. PtdChos can deplete the most abundant plasma proteins in protein corona profiles.
a, Normalized protein abundance (left axis, bar plot) and protein rankings (right axis, lollipop plot) in untreated plasma, untreated protein corona, and small-molecule treated protein corona. b, A stream (or alluvial) diagram illustrating the significant depletion of abundant plasma proteins, particularly albumin, following the incubation of plasma with NPs and PtdChos (only shared proteins with plasma are included). c, Total count of proteins identified in plasma, untreated protein corona, and protein corona treated with PtdChos at various concentrations (mean ± SD of three technical replicates). d, A stream diagram demonstrating the depletion pattern of abundant plasma proteins, especially albumin, in response to NP addition and enhanced with escalating concentrations of PtdChos (only shared proteins with plasma are included).

