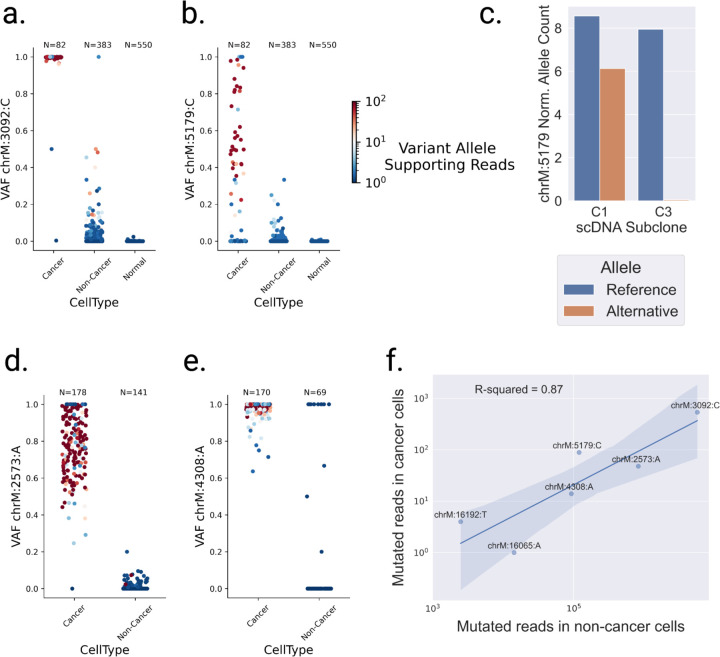
Figure 4: Non-cancer cells are contaminated by cancer cells mitochondria.
a,b, VAF of cells in patient P1 at loci a. chrM:3092:C and b. chrM:5179:C, categorized by reannotated cell types. Color gradient represents the number of variant allele reads per cell. Cells with more than 100 mutated reads are represented with 100 mutated reads. N refers to the number of cells with at least one read covering the locus. c. Number of reads supporting the reference or alternative allele in patient P1’s scDNA aneuploid (cancer) subclones C1 and C3 at locus chrM:5179, normalized by the number of cells per subclone. d,e, VAF of cells in patient P2 at loci d. chrM:2573:C and e. chrM:4308:C. f. Log aggregated mutated reads in non-cancer cells, as a function of log aggregated mutated reads in cancer cells for loci chrM:3092:C, chrM:5179:C and chrM:16192:T in patient P1, and chrM:2573:C, chrM:4308:C and chrM:16065:A in patient 2.

