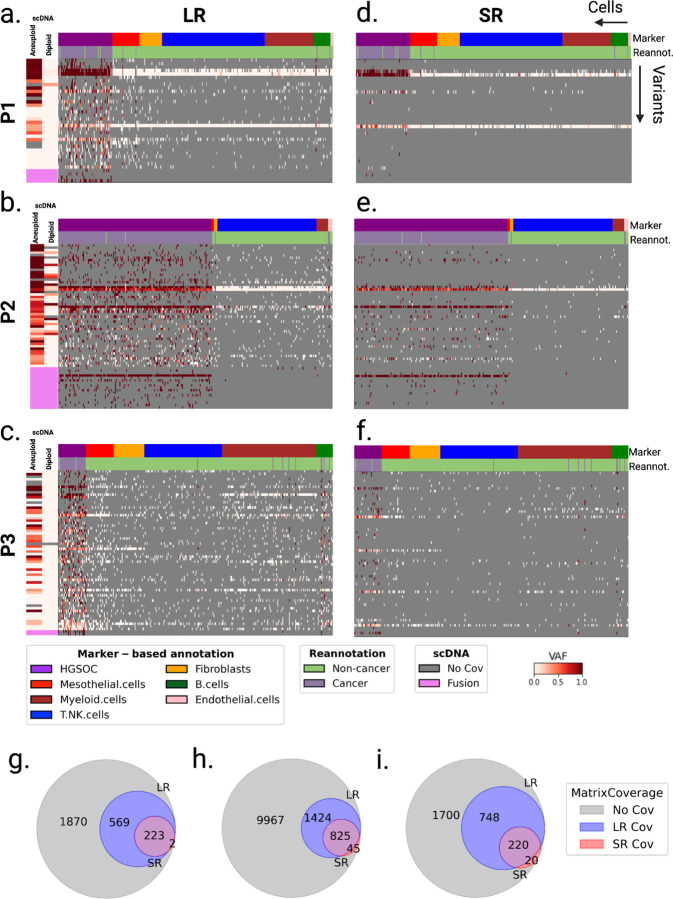
Figure 5: Patient-specific cell-variant matrices created from LR and SR scRNA-seq.
a-f. Matrices of somatic SNVs and fusions (rows) by single cells (columns) computed using LR sc-RNA-seq from the tumor biopsy of (a) patient P1, (b) P2 and (c) P3, and using SR sc-RNA-seq of (d) patient P1, (e) P2, and (f) P3, ordered by gene expression-derived cell types. VAF is depicted as a gradient from white (no mutated reads, VAF=0) to red (only mutated reads, VAF=1). Grey indicates no coverage in the cell at a given locus. Rows are colored by the scDNA VAF of aggregated diploid and aneuploid cells at the loci: SNVs with high aneuploid VAF and low diploid VAF are somatic in scDNA data. RNA fusions do not give a direct indication of the DNA breakpoint, thus we could not assess their presence in scDNA data, and they appear in pink. Columns are colored by marker-expression-derived cell-types (top row) and cell-types reannotated by LongSom (bottom row) d,e,f. Venn diagram of matrices’ positions covered in the cancer cells in (h) patient P1, (i) patient P2, and (i) patient P3, colored by sequencing data modality. Total positions equal n variants x m cancer cells. Blue indicates positions with coverage >0 in LR and 0 in SR. Red indicates positions with coverage 0 in LR and coverage >0 in SR. Purple indicates positions with coverage >0 in both LR and SR. Grey indicates positions with coverage 0 in both LR and SR.

