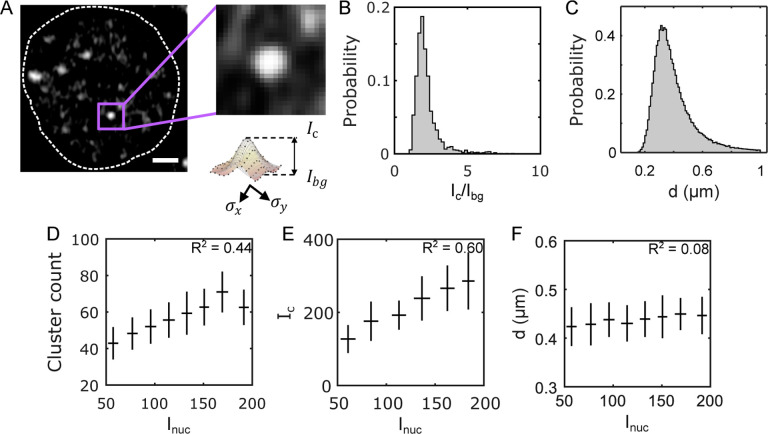
FIG. 2. Biophysical properties of Bcd clusters.
(A) A single nucleus showing Bcd-GFP heterogeneities. Close-up image (right) shows a single Bcd-GFP cluster. Cluster intensity fit with a 2D Gaussian (see profile below). The cluster intensity , the cluster background intensity , and the linear cluster size are extracted from this fit (Methods). (B) A histogram of the signal-to-noise ratio () and (C) a histogram of the linear size for 99671 clusters from 2027 nuclei in 14 embryos expressing Bcd-GFP. (D) Number of clusters per nucleus as a function of average nuclear Bcd-GFP intensity (mean ± std). (E) Average cluster intensity per nucleus as a function of average nuclear Bcd-GFP intensity (mean ± std). (F) Effective cluster diameter as a function of average nuclear intensity.

