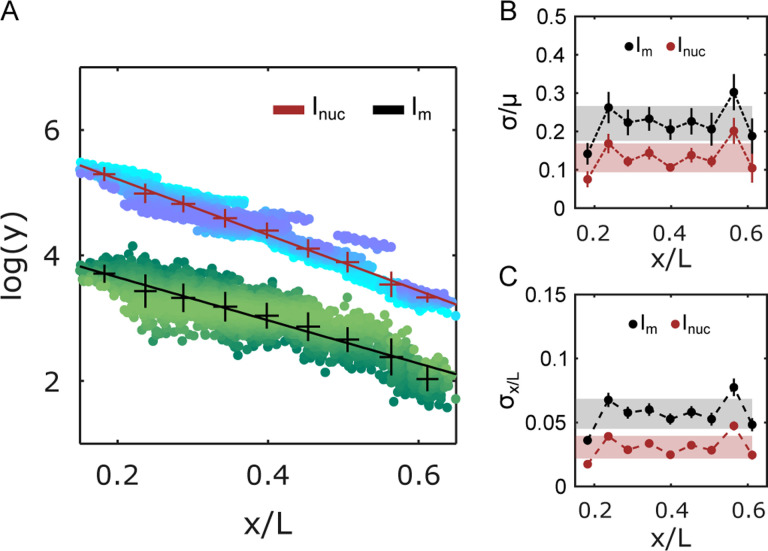
FIG. 3. Precision of cluster positional information potential.
(A) Natural logarithms of Bcd-GFP nuclear intensity (, crimson), and total Bcd-GFP cluster intensity (, black) are binned and plotted against binned nuclear position . The mean and standard deviation shown in the error bars are obtained by bootstrapping (14 embryos, 2027 nuclei). Exponential decay constants extracted from linear fits (solid lines) were , and . Each point in the data cloud (shades of blue and green) represents a single nucleus. (B) Errors in , and , normalized to the respective means are plotted against nuclear positions. Gray and red shades indicate the overall error in position estimate across the entire axis. (C) The effective error in the estimation of the nuclear positions using , and are plotted against nuclear position. Gray and red shades as in (B).

