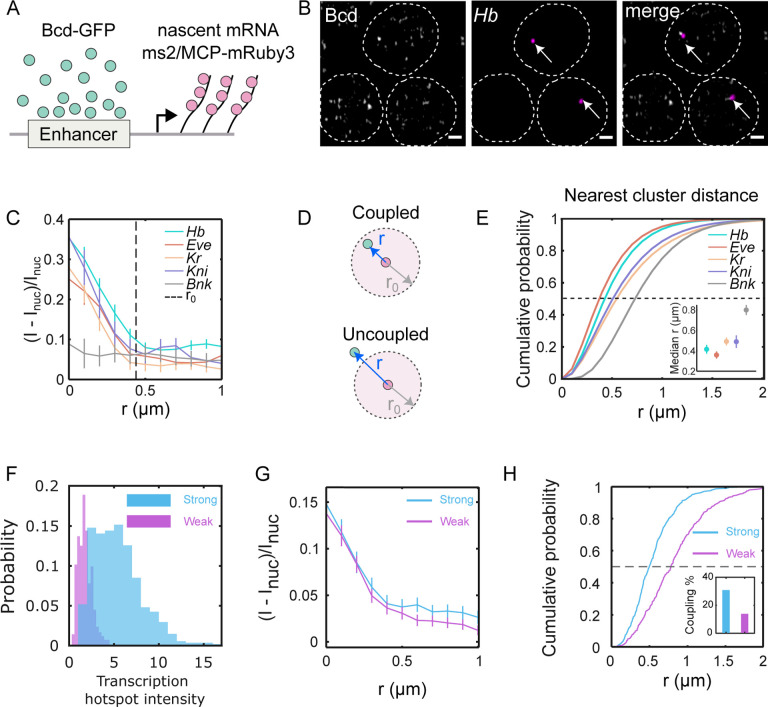
FIG. 4. Bcd clusters co-localization with target genes is enhancer dependent.
(A) Cartoon showing scheme for dual color imaging with Bcd-GFP (green) and nascent transcription site labeled via the MS2/MCP system (red). (B) Images from embryos in NC14 showing nuclei expressing Bcd-GFP and hb-MS2/MCP-mRuby on sites of active transcription (arrows); scale bar is . The dashed lines are guide to the eye for the nuclear boundaries. (C) Radial distribution of Bcd-GFP intensity with the centroid of the fluorescently labeled gene locus (i.e. hotspot) at the origin (see Methods). Data shown for canonical Bcd target genes, hb, eve, kr, kni, and the non-target gene bnk. Dashed line represents the average radius of accumulations from all genes combined . (D) Schematic showing the mRNA hotspot (red) and its nearest Bcd cluster (green). When the distance between the nearest cluster and the hotspot is less than the Bcd accumulation radius , the cluster is defined as being coupled to the gene; when it is greater than the cluster is assumed to be uncoupled. (E) Cumulative probability distributions of distances for various genes; color code as in C. Dashed line determines median at EC50 (i.e. cumulative probability of 0.5). Inset: median distances for all genes. Errors are calculated from bootstrapping. (F) Histograms showing the transcription hotspot intensity from a strong and a weak enhancer construct driving an MS2-fusion reporter. The strong construct generates a 3.2-fold higher intensity, on average. (G) The radial distributions of relative Bcd-GFP intensity with the centroid of the transcription hotspot as the origin. The accumulation radii and for the strong and weak enhancer constructs respectively are statistically identical. (H) Cumulative probability distributions of distances between the transcription hotspot and its nearest Bcd cluster. Black dashed line is at EC50. The median distances are and for the strong and weak constructs, respectively. Inset shows the fraction of coupled clusters for each construct (31 % and 13 %, respectively).

