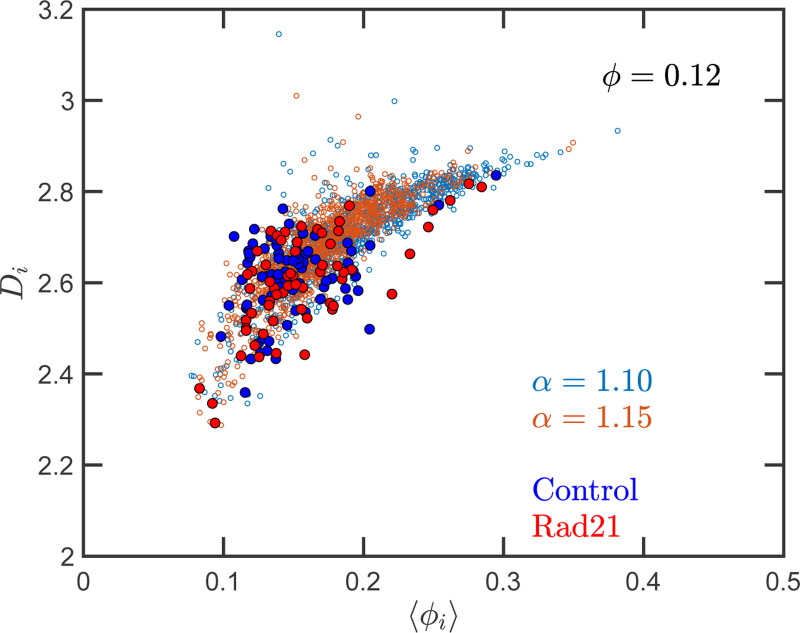
Figure 10. Effect of degrading Rad21 on the relation between packing parameter and chromatin volume concentration:
The small open symbols are the SR-EV results for , and 1.15. The filled symbols represent the experimental values obtained with ChromSTEM (Li et al., 2024) for the control sample (blue) and the Rad21 degrade sample (red)

