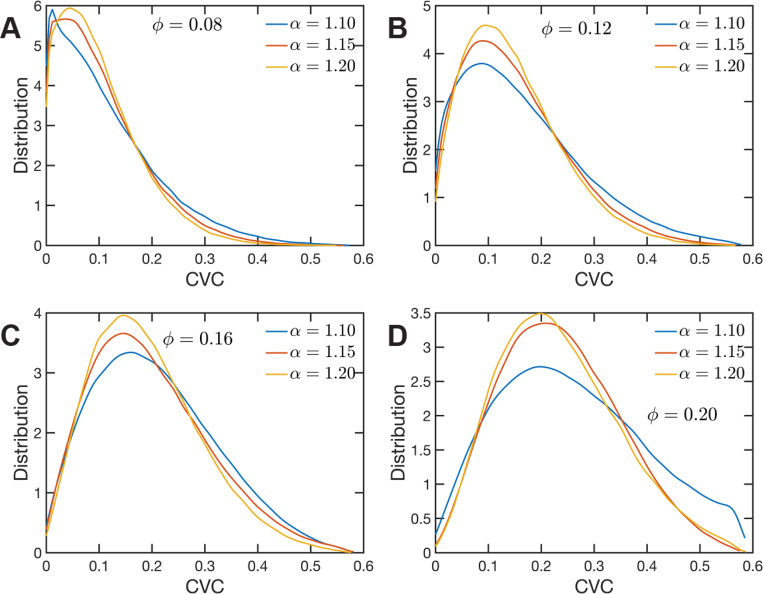
Figure 6.
Chromatin Volume Concentration for A) , B) , C) and A) and . The results for , are the closest to the experimental findings of Ref (Ou et al., 2017). produce CVC distributions with a much larger contribution of low density regions, and , over enhance the high density regions.

