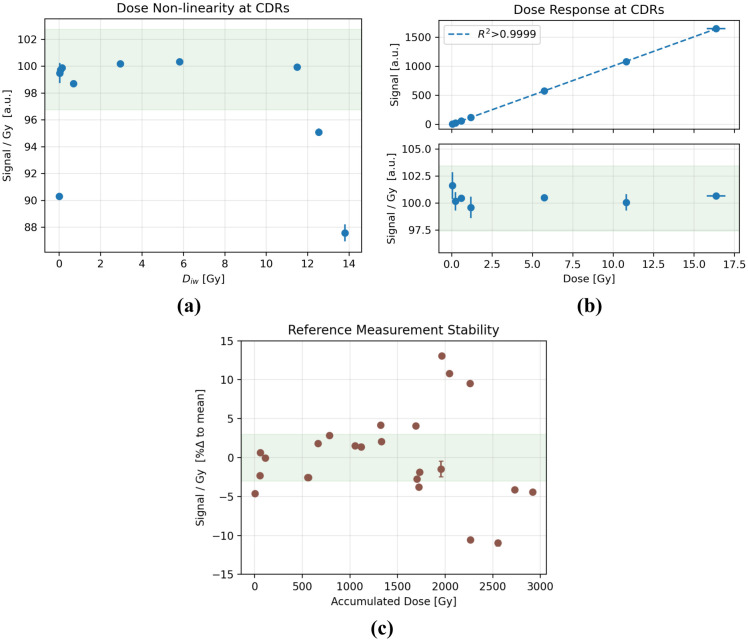
Figure 3.
(a) Signal per unit dose over a wide range of . (b) Dose response (top) and signal per unit dose (bottom) at CDRs wherein was kept between 0.05 and 0.14 Gy. (c) Dose-normalized signal change, reported as a percent change relative to the mean, at a reference setup over 10 non-consecutive days of measurements and ~3 kGy of accumulated dose. The green shaded region indicates a ±3% variance from the mean.

