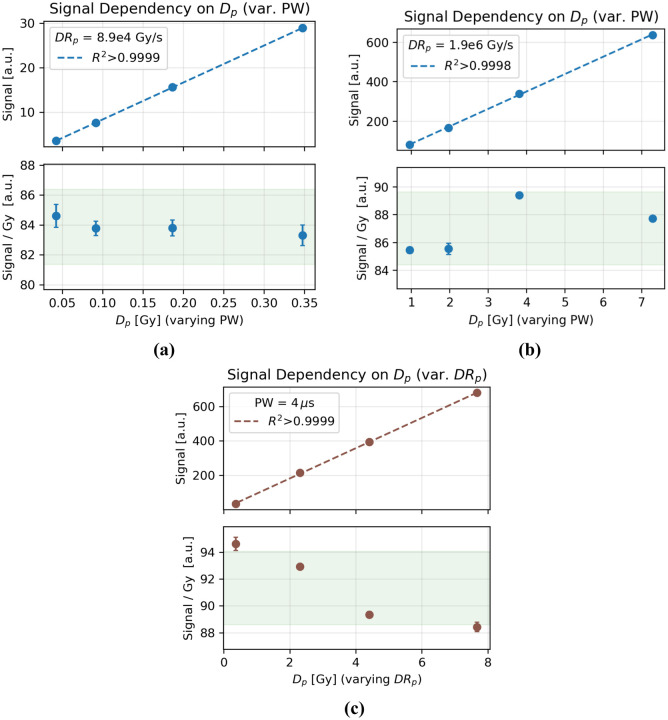
Figure 4.
Dose response as was increased by increasing at constant values of of either (a) 8.9e4Gy/s or (b) 1.9e6Gy/s. (c) The signal increased linearly with as the was increased at a constant . The signal per unit dose decreased with increasing . The green shaded region indicates a ±3% variance from the mean.

