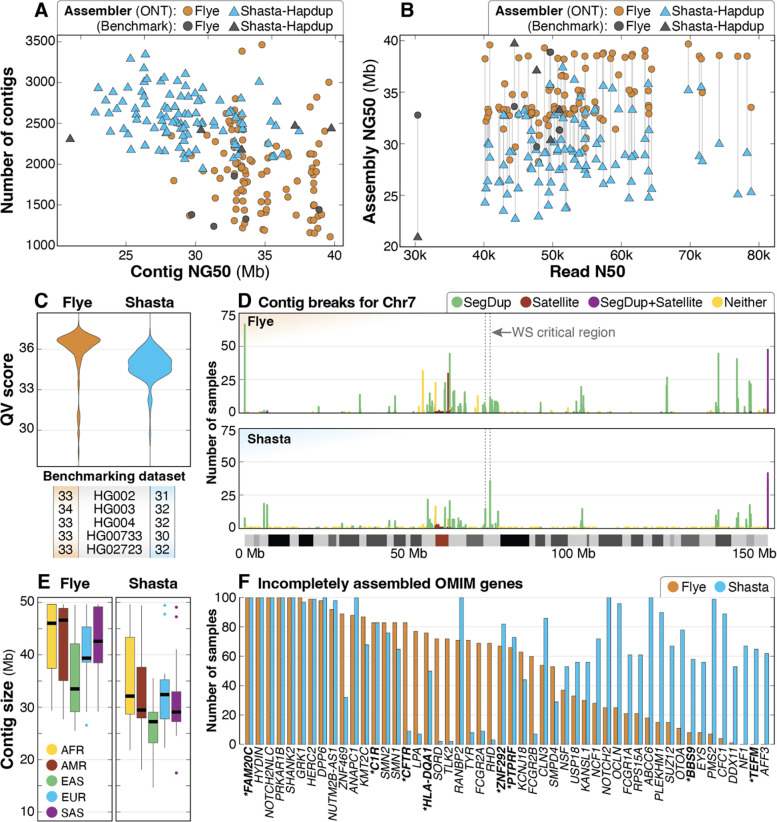
Figure 2. Summary of de novo assembly results.
A: Contig NG50 compared to total number of contigs for both assembly methods shows that the haploid assemblies generated by Flye are longer and have fewer contigs than Shasta-Hapdup, but no contigs generated by Flye exceed 40 Mbp. Assemblies for each benchmarking sample show similar statistics. B: Read N50 compared to assembly NG50 shows that assembly NG50 does not significantly improve with higher read N50. C: QV scores for both Flye and Shasta-Hapdup assemblies show slightly higher assembly QV scores for the haploid Flye assemblies. Values for the five benchmarking genomes are shown. D: Count of contig breaks for all 100 samples on chromosome 7 demonstrate that assembly breaks cluster in similar locations when using both assembly approaches and that there are a large number of single breaks spread across the chromosome. The 1.5–1.8 Mbp Williams-Beuren syndrome critical region is indicated with a dashed box and is flanked by clusters of assembly breaks within segdups (Morris 1993). The position of assembly breaks were categorized as “Satellite” (only satellite repeats), “SegDup+Satellite” (segdups and satellite repeats), “SegDup” (only segdups) or “Neither” (outside segdups and satellite repeat regions). E: Contig sizes filtered for contigs longer than 1 Mb for each superpopulation. F: OMIM genes incompletely assembled in 50 or more samples using either Flye (orange) or Shasta-Hapdup (blue). For Shasta-Hapdup, if one haplotype was completely assembled in a sample but the other was incomplete, the gene is counted as incompletely assembled. Assembly of 5 genes (FAM20C, HYDIN, NOTCH2NLC, PRKAR1B, and SHANK2) was incomplete for all 100 samples using both assemblers. Genes that are not in or do not contain a segdup are in bold with an asterisk.

