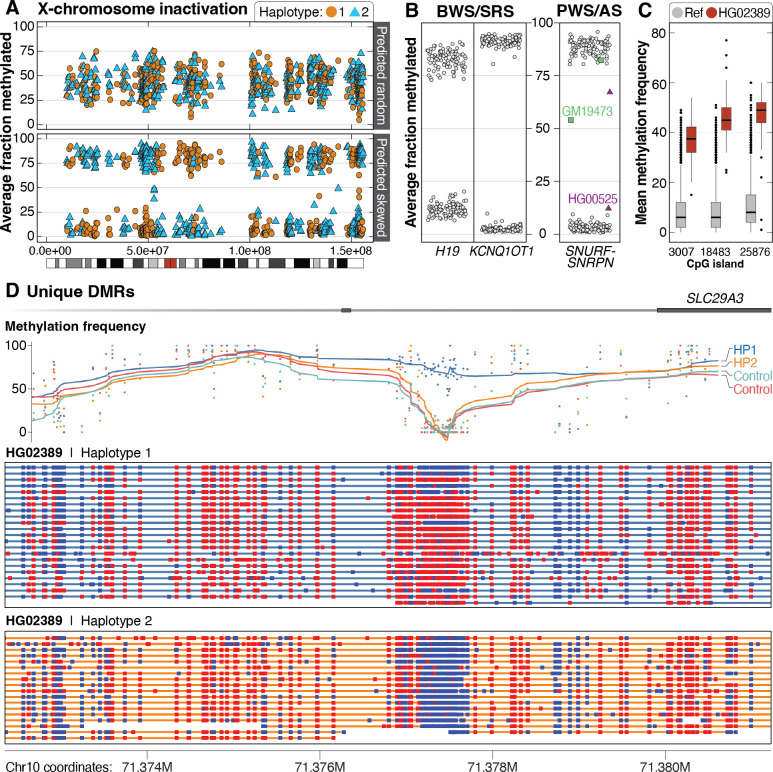
Figure 6. Patterns of methylation among the 1000 Genomes samples.
A. Among 69 46,XX samples, 42 had mixed X-chromosome inactivation (top, example from HG01414), while 27 were skewed (bottom, example from HG01801). The color differences are related to breaks in phasing and do not suggest methylation is mixed along a single haplotype. B. Haplotype-resolved methylation fraction is shown for three imprinted loci associated with four imprinting disorders. Methylated (>75%) or unmethylated (<25%) fraction at IC1 in H19 and IC2 in KCNQ1OT1, which are associated with BWS and SRS on 11p15.5. Haplotype-resolved methylation fraction is also shown for the CpG island within SNURF-SNRPN that is evaluated when testing for PWS or AS. Two samples have either gain (GM19473) or loss (HG00525) of methylation at this locus. C. Unique distinct methylation differences within defined CpG islands were identified in individual samples. An example from HG02389 shows three CpG sites with increased methylation (red boxes) compared to controls (gray). D. As an example, we identified one haplotype in HG02389 that has increased methylation at an internal CpG site (3007) within an intron of SLC29A3. Methylation frequency by haplotype is shown for HG02389 and one control (HG03022). Methylation status is shown for individual reads for each haplotype from HG02389 only (red indicates a methylated CpG; blue indicates an unmethylated CpG).

