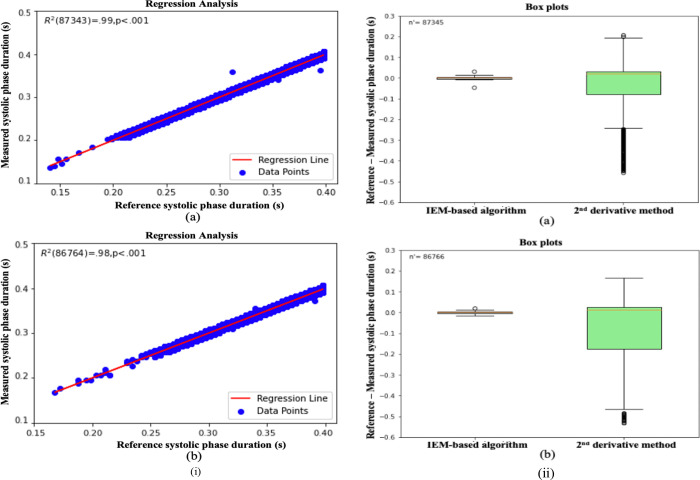
Fig. 7.
(i) (a) Regression analysis for the ABP waveforms, for the IEM method estimated systolic phase duration; (b) Regression analysis for the PPG waveforms, for the IEM method estimated systolic phase duration. (ii) Box Plots, comparison with the 2nd derivative for ABP waveforms (a) and PPG waveforms (b).

