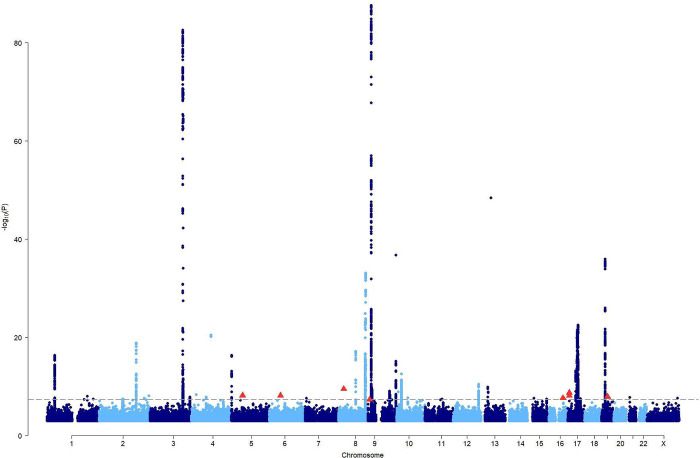
Figure 3:
Manhattan plot showing the associations with HGSOC from the meta-analysis of OCAC, UKBB and CIMBA summary association data. The dashed line is the genome-wide statistical significance level (P=5×10⁻⁸). The eight independent genome-wide statistically significant variants at seven novel loci are shown as red triangles.

