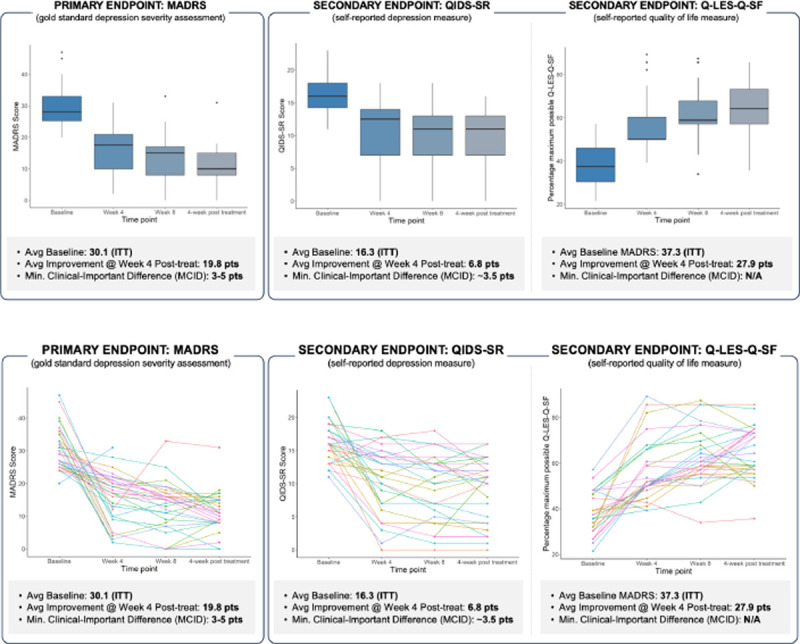
Figure 4: Comprehensive depiction of treatment response over time in patients with Major Depressive Disorder (MDD).

Top-left panel: Boxplot illustrating the distribution of MADRS scores at baseline and at weeks 4, 8, and 12. Top-right panel: Longitudinal trajectories of individual patient MADRS scores, indicating varied response patterns over the treatment course. Bottom panel: individual participant changes in MADRS scores from baseline, displayed at week 4, week 8, and at the 4-week post-treatment follow-up (final visit). The data collectively underscore the heterogeneity in treatment response and the progressive nature of symptom reduction over time.
