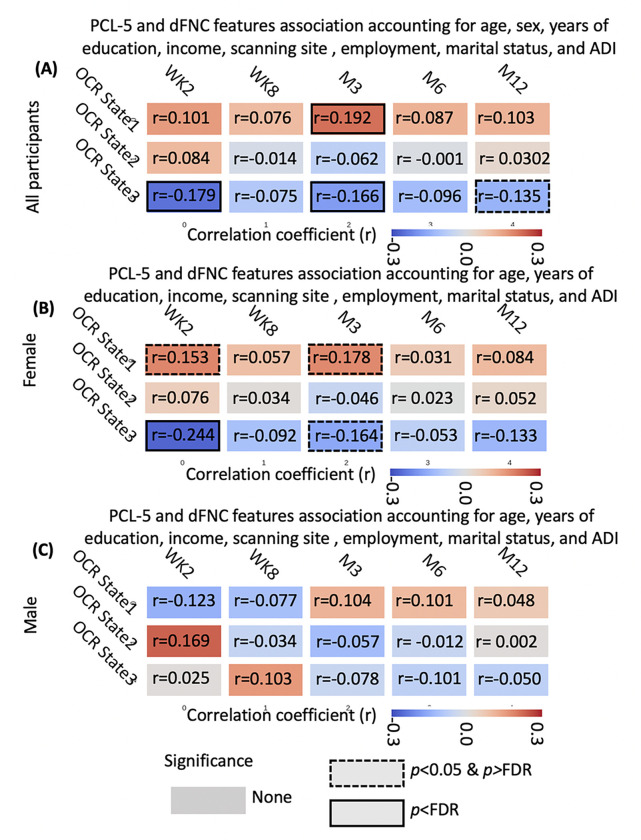
Figure 3. Dynamic functional network connectivity occupancy rates (OCRs) link with PCL-5 .
A) The correlation between OCRs estimated from WK2 resting-state fMRI recording and PCL-5 if different time point for the whole population. Occupancy rate (OCR) of state 1 and state 3 link with WK2 and M3 PCL-5. B) The correlation between OCRs estimated from WK2 resting-state fMRI recording and PCL-5 if different time point for the female group. Occupancy rate (OCR) of state 1 and state 3 link with WK2 and M3 PCL-5. C) The correlation between OCRs estimated from WK2 resting-state fMRI recording and PCL-5 in different time point for the male group. No association has been observed. WK2: week 2 after trauma, WK8: week 8 after trauma, M3: month 3 after trauma, M6: month 6 after trauma, and M12: month 12 after trauma. Correlations with associated p-values < 0.05 are highlighted with a dashed line box, while correlations with associated False Discovery Rate (FDR) p-values < 0.05 are emphasized with a solid line box. The color bar represents the strength of correlation.

