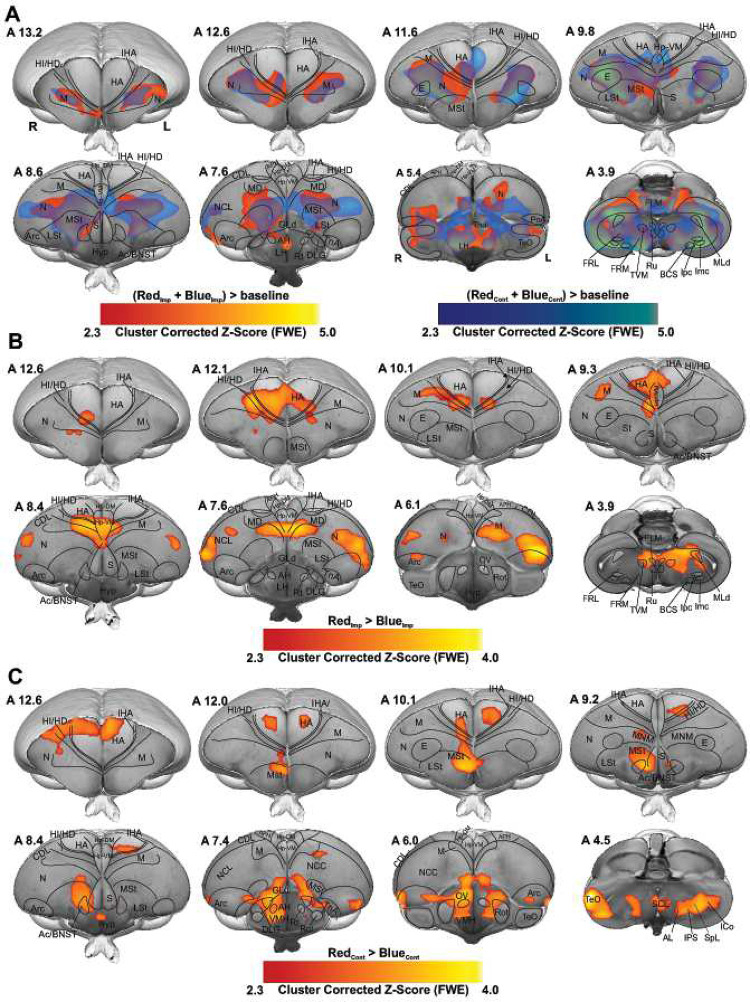
Figure 2-.
Colour preference of different groups. (A) GLM analysis was used to demonstrate activated networks during imprinting and control trials by examining RedImp + BlueImp > baseline (red map) and BlueCont + RedCont > baseline (blue map) contrasts. The colour maps show the activation significance of group-averaged data from 17 chicks (9 red group + 8 blue group) in the axial view (group analysis using a mixed model FLAME 1+2 method, Z = 2.3, and p < 0.05 FEW corrected at the cluster level). (B) the contrast map shows the significant increase of BOLD signal during Red colour as imprinting stimulus compared to Blue colour as imprinting stimulus (RedImp > BlueImp contrast, 9 chicks for red group and 8 chicks for blue group). (C) Activation map showing the strong BOLD response during the Red colour as control stimulus for the blue group compared to the Blue colour as control stimulus for red group (BlueCont < RedCont, 9 chicks for red group and 8 chicks for blue group). The functional maps were superimposed on the high-resolution anatomical data at the different levels of an ex vivo chick brain (in grayscale).

