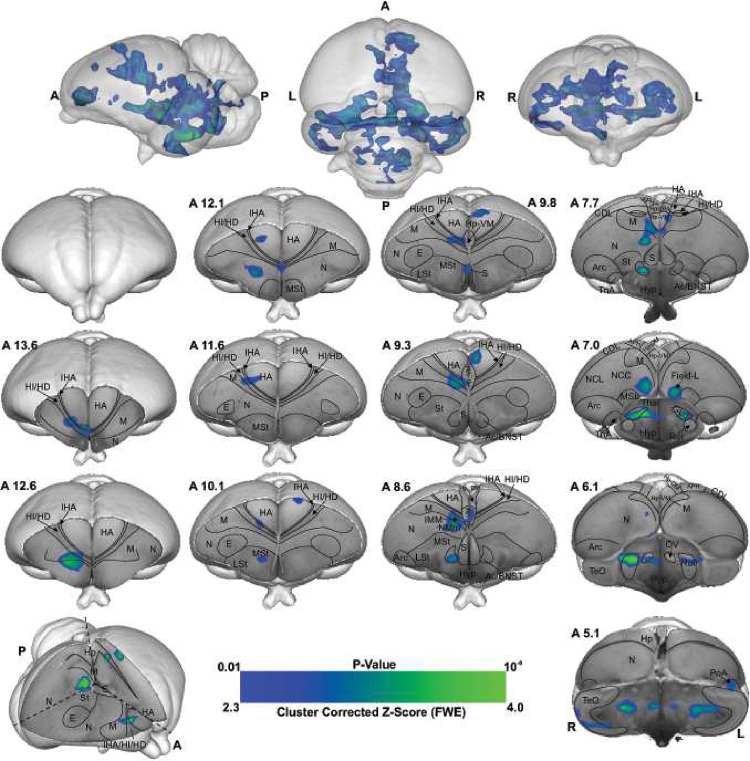
Figure 4-.
BOLD response pattern during the acquisition of imprinting memory. Statistical maps for the BOLD signal increase in the contrast of red light versus blue light in the Blue group (n = 8, Z = 2.3, and p < 0.05 FEW corrected at the cluster level). The top row images show the 3D representation of the activation pattern inside a translucent chick brain. A 3D depiction of the chick brain is represented at the bottom of the left column with an example window at the level of A 7.0. Anatomical borders (black lines) are based on the contrast difference of ex-vivo chick brain and Chick atlas29,30. The corresponding abbreviations of ROIs are listed in the Table S1.

