. 2024 Feb 21;12:RP86638. doi: 10.7554/eLife.86638

Figure 3. PT firing kinematics in the presence of varying external viscosity.

(A) Schematic outlining the protocol for hypothesis testing. We experimentally measured the PT firing kinematics of A. algerae spores in buffers with varying viscosity, by varying the methylcellulose (MC) concentrations up to 4% (Videos 4 and 5). We next calculated the required total energy, peak pressure and peak power for each experimentally measured data according to our physical framework proposed in Figure 3—figure supplements 13, and we see if the required energy changes with respect to changes in surrounding viscosity. We assume that changing surrounding viscosity should not change the energy sources of the spores. Thus if the calculated energy requirement changes significantly with respect to changes in surrounding viscosity (p<0.05), the hypothesis is inconsistent with experimental observations. (B) Experimental measurement of PT ejection kinematics of A. algerae spores in different concentrations of methylcellulose. The kinematics was fit to a sigmoid function y=L(11+ek(xx0)11+ekx0) and then normalized by L. The additional term in the sigmoid function is to ensure the curve passes the origin. (0%: n=12; 0.5%: n=10; 1%: n=10; 2%: n=8; 3%: n=5; 4%: n=9) The inset shows the original data in MC0%. The changes in MC concentration does not cause obvious changes in overall kinematics of PT firing. The complete set of original data can be found in Figure 3—figure supplement 5. (C) The dependence of maximum PT ejection velocity on MC concentration in germination buffer. Increasing MC concentration up to 4% does not change the maximum PT ejection velocity. (p=0.848, Kruskal–Wallis test) (D) Viscosity measurements of germination buffer with various concentrations of methylcellulose, corresponding to the concentrations used in PT extrusion experiments. As the PT ejection process is a high shear rate phenomenon (∼3000 1 /s), we used the measurement at shear rate γ˙=1000 s-1. The maximum tested shear rate was 1000 s-1 as that reaches the operation limit of the shear rheometer. (n=5 for 0%, 0.5%, 1%. n=3 for 2%, 3%, 4%.).

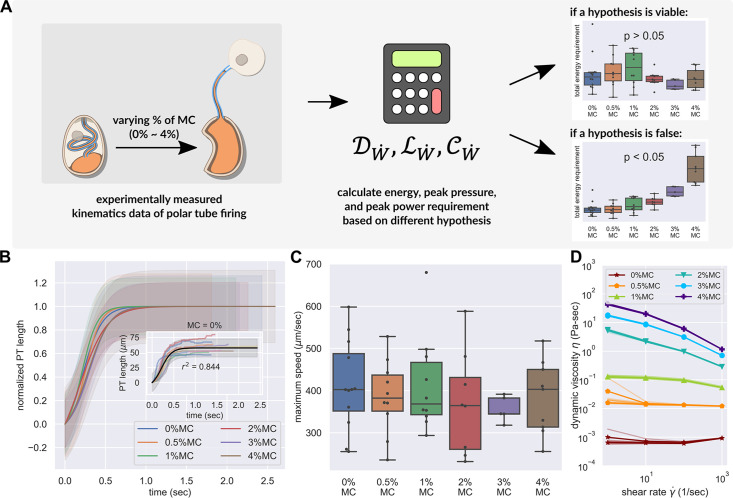
Figure 3.

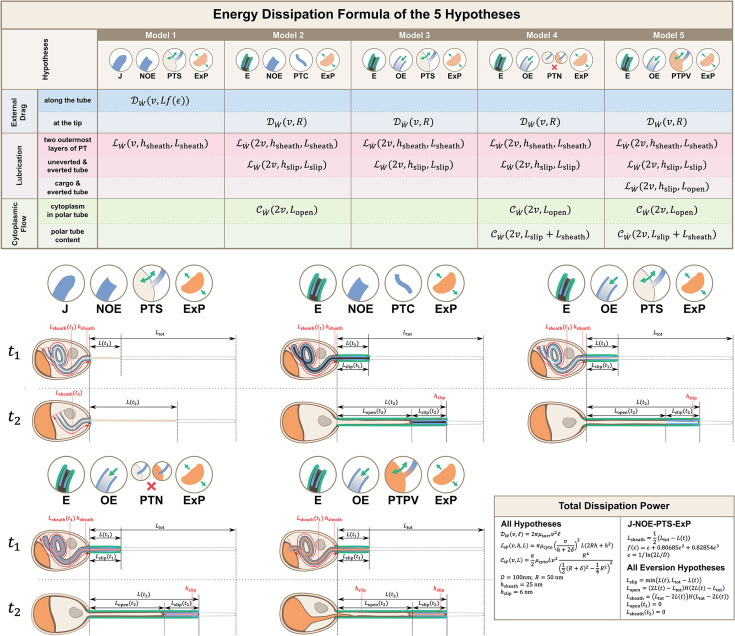
Figure 3—figure supplement 1. Calculations for energy dissipation of the PT firing process.

Figure 3—figure supplement 1.

We calculated the energy dissipation of the PT firing process by considering the power contribution from external drag, lubrication between various structures, and cytoplasmic flow. The table in the top row shows the detailed breakdown of energy contribution for the five hypotheses listed in Figure 2. We calculate the instantaneous power from experimental data, and integrate it with respect to time to obtain the energy. The detailed formula used for each terms are listed in the lower right corner. The bottom two rows of the figure shows the schematic diagram for calculating the different lengths in each hypothesis. t1 indicates some time point when the PT fires less than 50%, and t2 indicates another time point when PT fires more than 50%. The blue region indicates the uneverted region, while the green region indicates the portion that has everted. Symbols: μcyto: cytoplasmic viscosity; μsurr: viscosity of the surrounding media; v: PT tip velocity; L: PT length; Ltot: total length of ejected PT; Lsheath: overlapping length of the two outermost layers of PT; Lslip: overlapping length of everted and uneverted PT; Lopen: length of the PT that does not contain uneverted PT material; D: PT diameter; R: PT radius; ϵ: shape factor in slender body theory, defined as 1/ln(2L/D): slip length; hsheath: lubrication thickness between the two outermost layers of PT; hslip: lubrication thickness between everted and uneverted tube, or the cargo and everted tube; H: Heaviside step function.
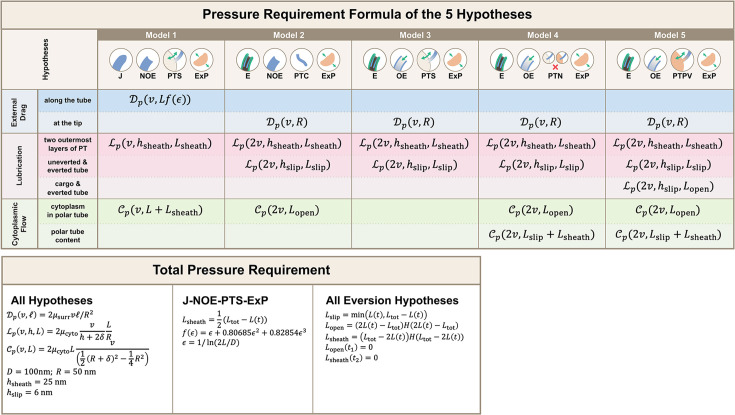
Figure 3—figure supplement 2. Calculations for the required pressure differences of the polar tube (PT) firing process.

Figure 3—figure supplement 2.

Calculations were made by considering the contribution from external drag, lubrication between various structures, and cytoplasmic flow. Detailed breakdown of contributions for the five hypotheses listed in Figure 2 are shown, and the formula used for calculating different segment lengths based on observed PT length for each hypothesis is listed in the bottom. Symbols: μcyto: cytoplasmic viscosity; μsurr: viscosity of the surrounding media; v: PT tip velocity; L: PT length; Ltot: total length of ejected PT; Lsheath: overlapping length of the two outermost layers of PT; Lslip: overlapping length of everted and uneverted PT; Lopen: length of the PT that does not contain uneverted PT material; D: PT diameter; R: PT radius; ϵ: shape factor in slender body theory, defined as 1/ln(2L/D): slip length; hsheath: lubrication thickness between the two outermost layers of PT; hslip: lubrication thickness between everted and uneverted tube, or the cargo and everted tube; H: Heaviside step function.
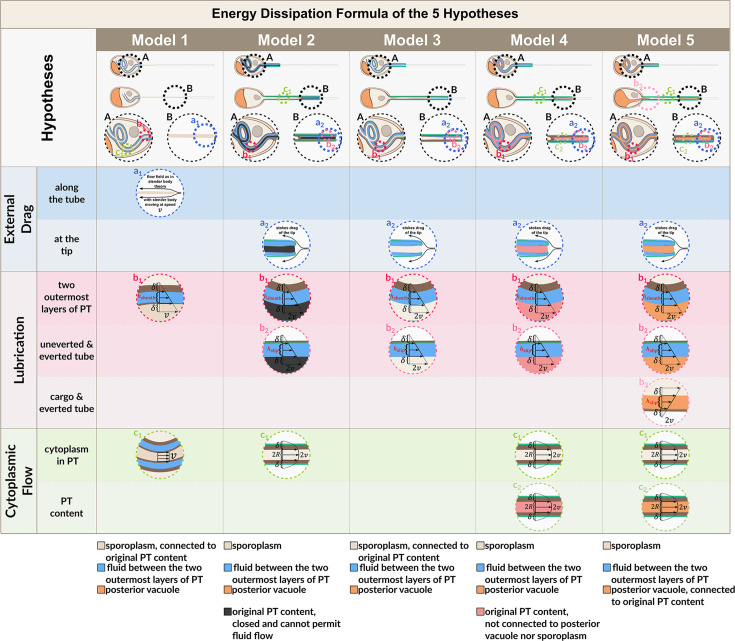
Figure 3—figure supplement 3. Flow fields used for energy dissipation calculation in Figure 3—figure supplement 1 and Figure 3—figure supplement 2.

Figure 3—figure supplement 3.

Model schematics as listed in the bottom of Figure 3—figure supplement 1 at t1 and t2 are shown, with serial magnifications to show the flow field. Dashed circles of the same color indicate the magnification of the same specific region of interest. See Appendix Section A.9 for detailed explanation of each term. Symbols: v: PT tip velocity; D: PT diameter; R: PT radius; δ: slip length; hsheath: lubrication thickness between the two outermost layers of PT; hslip: lubrication thickness between everted and uneverted tube, or the cargo and everted tube.
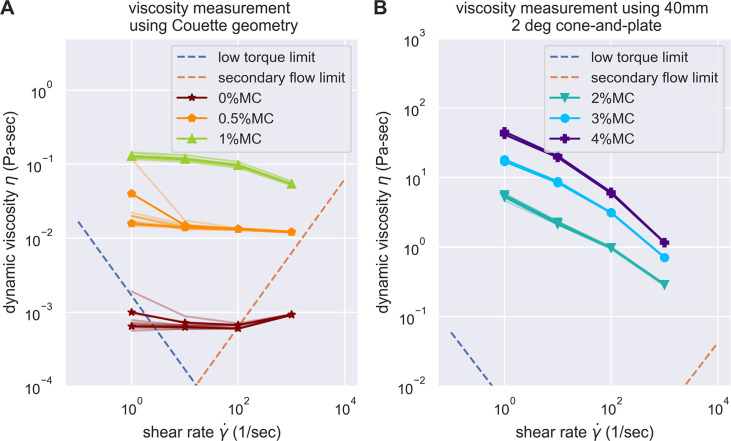
Figure 3—figure supplement 4. Evaluation of the experimental challenges of shear rheology in the measurement of buffer viscosity.

Figure 3—figure supplement 4.

Low torque limit and secondary flow limit was considered, according to the suggestion of Ewoldt et al., 2015. The data acquired were all above the experimental limit of shear rheometer, except for the buffer with 0% methylcellulose at the highest and lowest shear rate. However, as buffer with 0% methylcellulose is expected to be Newtonian, we can easily substitute it with measurements on other shear rate.
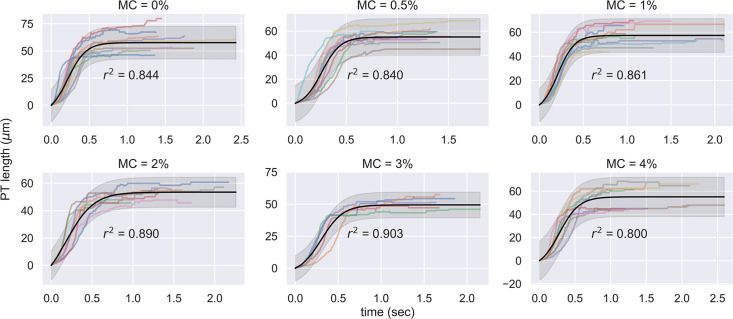
Figure 3—figure supplement 5. Experimental measurement of PT ejection kinematics of A.algerae spores in different concentrations of methylcellulose.

Figure 3—figure supplement 5.

The kinematics was fit to a sigmoid function­y=L(11+ek(xx0)11+ekx0). The additional term in the sigmoid function is to ensure the curve passes the origin. (0%: n=12; 0.5%: n=10; 1%: n=10; 2%: n=8; 3%: n=5; 4%: n=9).
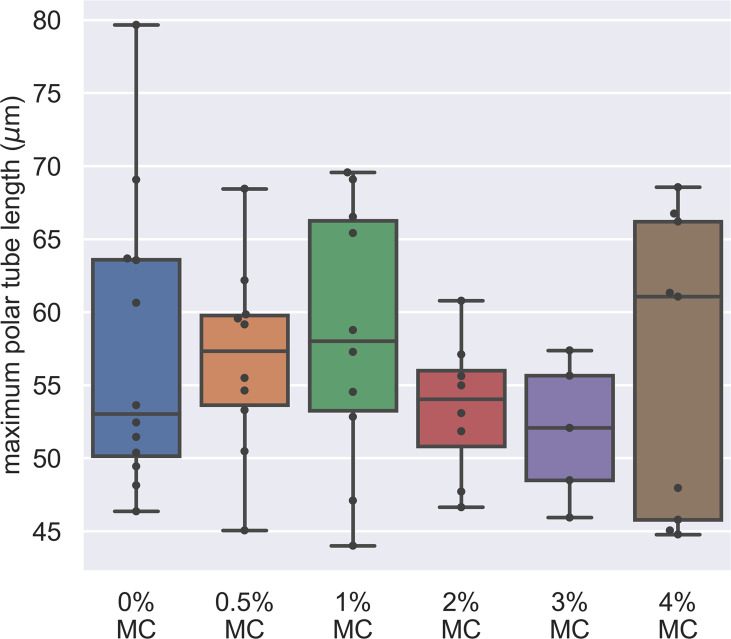
Figure 3—figure supplement 6. Dependence of maximum PT length on the methylcellulose concentration in germination buffer.

Figure 3—figure supplement 6.

The x-axis shows the different concentration of methylcellulose we used for our experiments, and the y-axis shows the maximum PT length of each germination event. The maximum PT length does not depend on the concentration of methylcellulose in the germination buffer. (p=0.743, Kruskal–Wallis test).