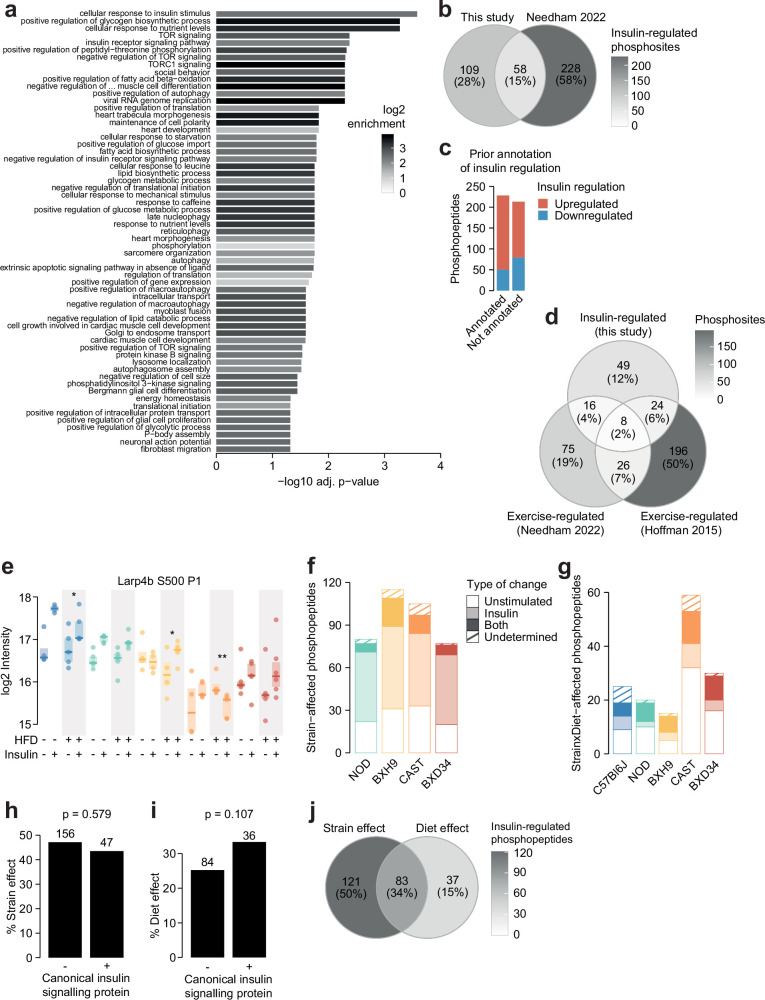
(
a) The enrichment of Gene Ontology (GO) biological processes in genes containing insulin-regulated phosphopeptides relative to the entire phosphoproteome (one-sided Fisher’s exact test, Benjamini-Hochberg p-value adjustment). Only significant pathways are shown (adj. p<0.05). The pathway ‘negative regulation of vascular-associated smooth muscle cell differentiation’ is abbreviated. (
b) The number of phosphosites regulated by insulin in this study or a previous phosphoproteomic study of human skeletal muscle (
Needham et al., 2022). Only phosphosites quantified in both studies were considered. (
c) The number of insulin-regulated phosphopeptides with prior annotation of insulin regulation in the PhosphositePlus database (
Hornbeck et al., 2015). (
d) The number of phosphosites regulated by insulin in this study or regulated by exercise in two human phosphoproteomics studies (
Needham et al., 2022;
Hoffman et al., 2015). Only phosphosites quantified in all three studies were considered. (
e) A phosphopeptide where HFD-feeding enhanced insulin responses in BXH9 but suppressed insulin responses in C57Bl6J and CAST. A two-way ANOVA was performed on insulin response values followed by two-sided t-tests comparing HFD to CHOW within each strain (q-values: *). (
f) Phosphopeptides with a Strain effect were examined to determine whether the effect was due to altered unstimulated phosphorylation (‘Unstimulated’; Strain/C57Bl6J fold change >1.3 in unstimulated samples), altered insulin-stimulated phosphorylation (‘Insulin’; Strain/C57Bl6J fold change >1.3 in insulin-stimulated samples), or both (‘Both’). A proportion of phosphopeptides passed neither of these filters (‘Undetermined’). (
g) The same analysis was performed on Strain×Diet-affected phosphopeptides, using the HFD/CHOW fold changes in either unstimulated or insulin-stimulated samples for each strain. (
h–i) The percentage of (
h) Strain effects and (
i) Diet effects (Uniform diet or Strain×Diet effect) among canonical or non-canonical insulin signalling proteins. p-Values indicate two-sided Fisher’s exact tests. The number of phosphopeptides in each group is shown. (
j) The overlap of Strain and Diet effects.


