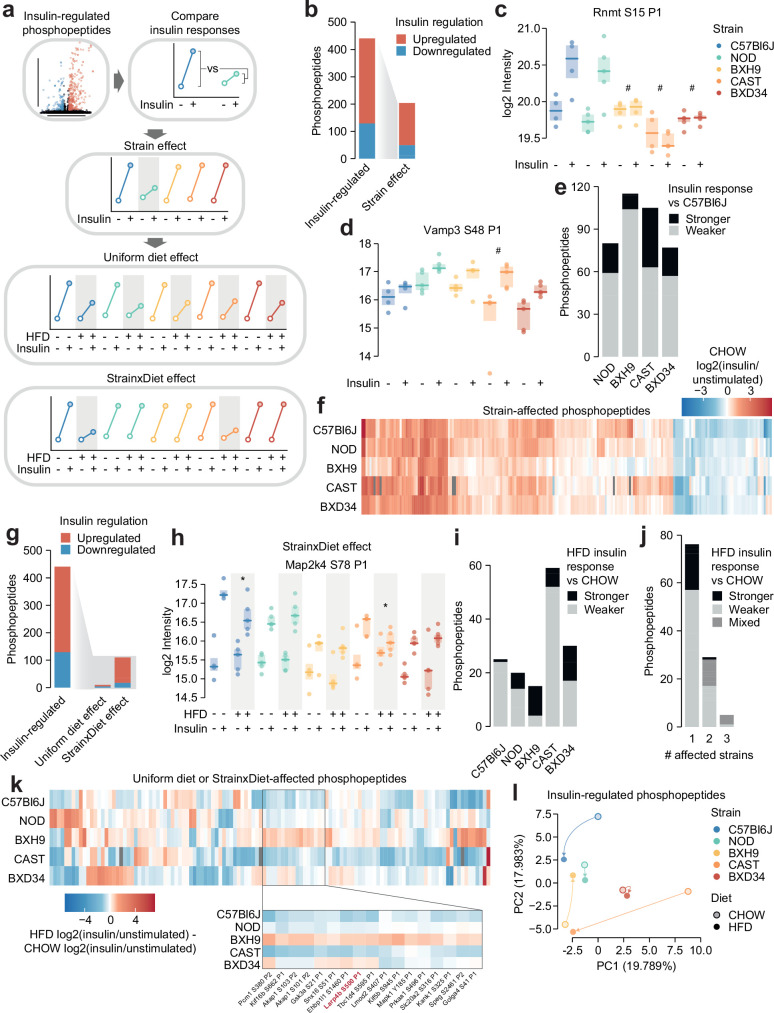
Figure 2. Genetics and diet modulate insulin signalling.
(a) Schematic for identifying effects of strain and diet on insulin signalling. (b) The number of total insulin-regulated phosphopeptides and those with a Strain effect. (c–d) Two phosphopeptides with Strain effects. ANOVAs were performed on CHOW insulin responses following two-sided t-tests comparing each strain to C57Bl6J (q-values: #). Only CHOW values are shown. (e) The number of phosphopeptides with stronger or weaker insulin regulation in each strain compared to C57Bl6J. (f) Heatmap displaying all insulin-regulated phosphopeptides with a Strain effect. Missing values are coloured grey. (g) The number of total insulin-regulated phosphopeptides and those with diet effects. (h) A phosphopeptide with a Strain×Diet effect. A two-way ANOVA was performed on insulin response values followed by two-sided t-tests comparing HFD to CHOW within each strain (q-values: *). (i–j) The number of phosphopeptides with a Strain×Diet effect in (i) each strain, or (j) each number of strains. Colour indicates whether the insulin response in HFD is stronger vs CHOW, weaker vs CHOW, or both in different strains (‘Mixed’). (k) Heatmap displaying all insulin-regulated phosphopeptides with a Uniform diet effect or Strain×Diet effect. Inset displays example sites where BXH9 effects contrasted other strains. (l) Principal component analysis (PCA) of all insulin-regulated phosphopeptides using the log2(insulin/unstimulated) fold changes for each strain-diet combination. The percentage of total variance explained by each principal component is indicated. */#: 0.01≤q<0.05, **/##: 0.001≤q<0.01, ***/###: q<0.001. n=4–6 biological replicates.

