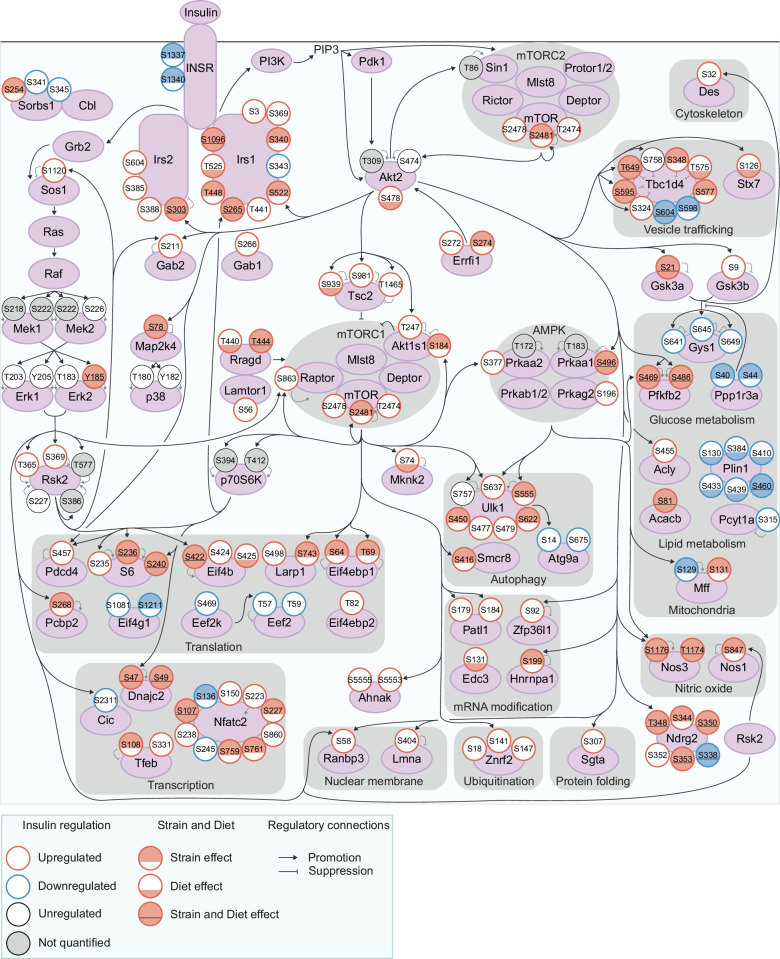
Figure 3. Exploring genetic and dietary modulation of the insulin signalling network.
A curated network of 160 insulin-regulated phosphosites. Phosphosites are depicted as circles where the outline colour denotes the direction of insulin regulation, and the inner colour denotes the presence of Strain effects or Diet effects (either a Strain×Diet or Uniform diet effect). Black arrows indicate regulatory relationships from proteins to other proteins or phosphosites. Grey lines indicate phosphosite regulatory roles.

