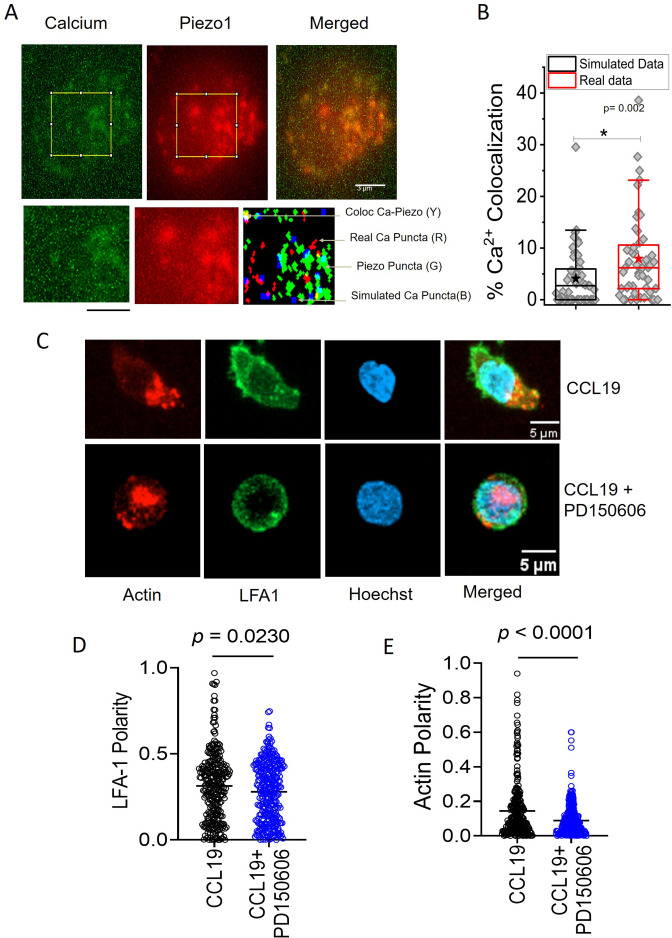
Figure 5. Local Ca2+ mobilization with Piezo1 redistribution upon chemokine stimulation.
(A) Representative total internal reflection fluorescence (TIRF) image of a Jurkat Cell stained with Fluo-3, AM and transiently expressing with Piezo1 mCherry. Lower panel: zoomed-in image and overlap of binary images of objects detected from Calcium and Piezo channels as well as simulated randomly placed punctas having similar total (in the zoomed-in section) and average area as that of the Calcium punctas detected in the real images. Overlap RGB image shows the overlap between real calcium (red) and piezo puncta (green), overlap puncta (yellow), and simulated calcium puncta (blue). (B) Comparison between percentage calcium colocalization of simulated data and real data. * Denote p<0.05 calculated using Mann Whitney U test. n cell = 52 (13 cells x 4 time points). NROIS = 52. (C) Representative confocal images of LFA1 and actin distribution in CCL19-stimulated CD4 + T lymphocytes with or without inhibition of calpain. 100 μM of PD15606 was added to the cells 1 hr prior to the addition of chemokine. Quantitative comparisons of (D) LFA1 and (E) actin polarity upon chemokine stimulation, in the presence or absence of calpain pre-inhibition. n>290 random cells, each. All data is generated from at least three independent experiments. Student’s t-test was used to calculate significance and data is represented as mean ± S.E.M.


