. 2024 Feb 23;12:RP91903. doi: 10.7554/eLife.91903

Figure 6. Piezo1 deficiency disrupts F-actin retrograde flow in T cells despite chemokine receptor activation.

(A) Representative fixed confocal images of actin and Piezo1 distribution in CD4+ T lymphocytes after 30 min of 0.5 µg/ml recombinant CCL19 treatment. (B) Representative fixed confocal images of actin distribution in chemokine-treated, control and Piezo1-knockdown CD4 + T lymphocytes. (C) Quantitative comparison of actin polarity in control and Piezo1-knockdown CD4+ T lymphocytes cells after 30 min of chemokine treatment. n>300 random cells, each. Front-back (F/B) of Piezo1 and actin-GFP in untreated (D) and SDF1α treated (E) Jurkat cells co-expressing actin-GFP and Piezo1-mCherry. (F) A snapshot of time-lapse imaging of Piezo1-mCherry and actin-GFP expressing Jurkat cell treated with 0.1 µg/ml of SDF1α. Image is the maximum Z-projection of the cell at 63 X/1.40 magnification. All data is generated from at least three independent experiments.

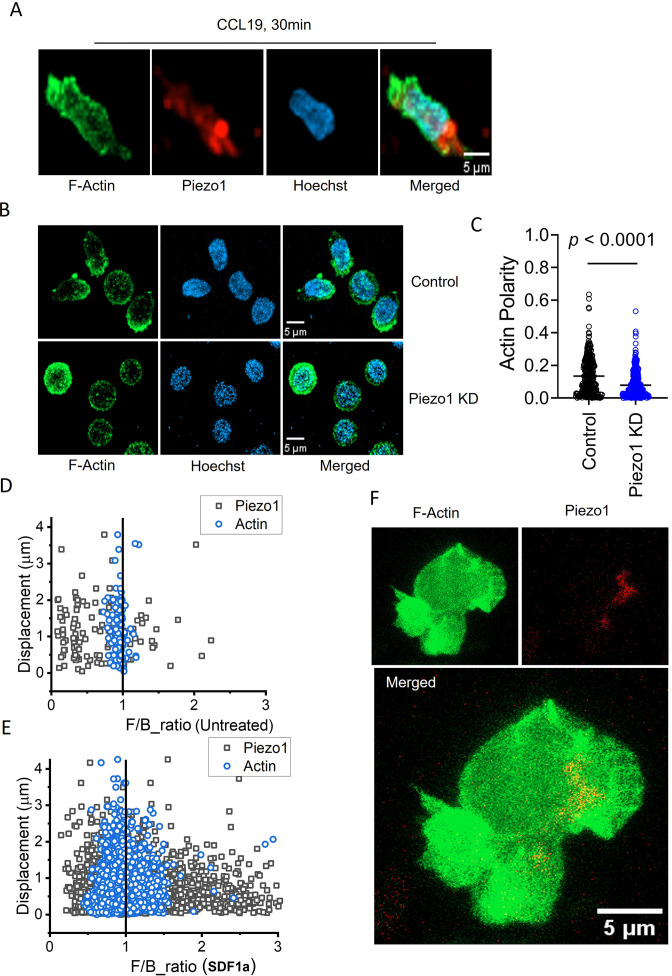
Figure 6.

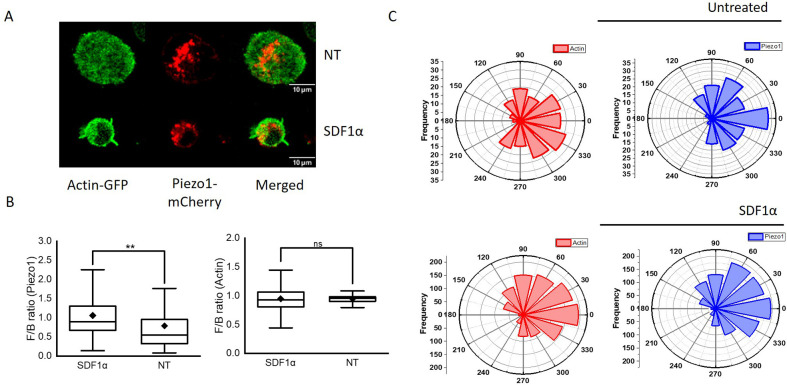
Figure 6—figure supplement 1. Leading edge polarity of Piezo1-mCherry and dynamic distribution of actin-GFP in SDF1α-treated Jurkat cells.

Figure 6—figure supplement 1.

(A) Representative 2D confocal image of Jurkat cell expressing Piezo1 mCherry and actin GFP in the absence (top panel) or presence (bottom panel) of recombinant SDF1α. (B) Box plots depicting Piezo1 mCherry (left) and actin-GFP (right) front-back polarity in untreated (NT) and chemokine-stimulated conditions. (C) Polar plots depicting relative Piezo1 mCherry and actin-GFP spatial distribution in Jurkat cells with respect to direction of cell trajectory in untreated (top panel) and SDF1α (bottom panel) treated cells. Spatial distribution was calculated for all the time points of time-lapse imaging (see methods).
Figure 6—animation 1. Representative 3D rendering of confocal Z-stacks of CD4+ T lymphocyte depicting Piezo1 and actin distribution, upon 30 min of recombinant CCL19 treatment.
Download video file (42.2KB, mp4)
63X magnification. Related to Figure 6A.
Figure 6—animation 2. Representative 3D rendering of confocal Z-stacks of control siRNA-transfected CD4+ T lymphocyte depicting actin polarity, upon 30 min of recombinant CCL19 treatment.
Download video file (105.8KB, mp4)
63X magnification. Related to Figure 6B.
Figure 6—animation 3. Representative 3D rendering of confocal Z-stacks of Piezo1 siRNA-transfected CD4+ T lymphocyte depicting loss of actin polarity, after 30 min of recombinant CCL19 treatment.
Download video file (102.7KB, mp4)
63X magnification. Related to Figure 6B.
Figure 6—animation 4. Representative time-lapse animation of Piezo1-mCherry/actin-GFP expressing Jurkat cell, moving on ICAM1-coated dish in the presence of recombinant human SDF1α.
Download video file (247.3KB, mp4)
Images were acquired as a Z-stack (1µm per stack) at 63X/1.40 oil magnification. Total duration of time-lapse was 5 min at 30 s per frame. Images are represented as maximum intensity projections of the Z stack. Related to Figure 6F.