. 2024 Feb 12;12:RP90648. doi: 10.7554/eLife.90648

Figure 5. The blocking hairpin structure corresponds to an N-terminal sequence of CLC-2.

(A) Left: The hairpin structure seen in the cryoEM density (blue mesh) fits N-terminal residues 14–28 (blue). Right: The subunit in CLC2-CTDasym structure that contains a C-terminal domain (CTD) with rotated orientation lacks density for the hairpin structure. In this structure, the residues linking transmembrane (TM) helices J and K are not resolved. The dark blue circles indicate this unresolved region (right panel) and the corresponding resolved J-K helix that occurs in the other subunits. (Contour level: 0.76, 5.5 σ.) (B) Model validation using Q-scores for the N-terminal hairpin: orange and light orange for subunits A and B of CLC2-CTDsym subunit; yellow for subunit A (the hairpin-containing subunit) of CLC2-CTDasym. The black line represents the expected Q-score at 2.75 Å based on the correlation between Q-scores and map resolution. (C) Residues on the TM domain interact with the N-terminal hairpin. The J-K helical linker and TM helices C, D, R, and J are labeled with arrows. Inset: Zoomed-in view of two hydrogen bonds formed between the hairpin structure and the TM domain: Q19–Q153 and T20–R363. Mutation of these two residues (Q25 and T26 in rat CLC-2) generated an open-channel phenotype for CLC-2 expressed in Xenopus oocytes (Gründer et al., 1992).

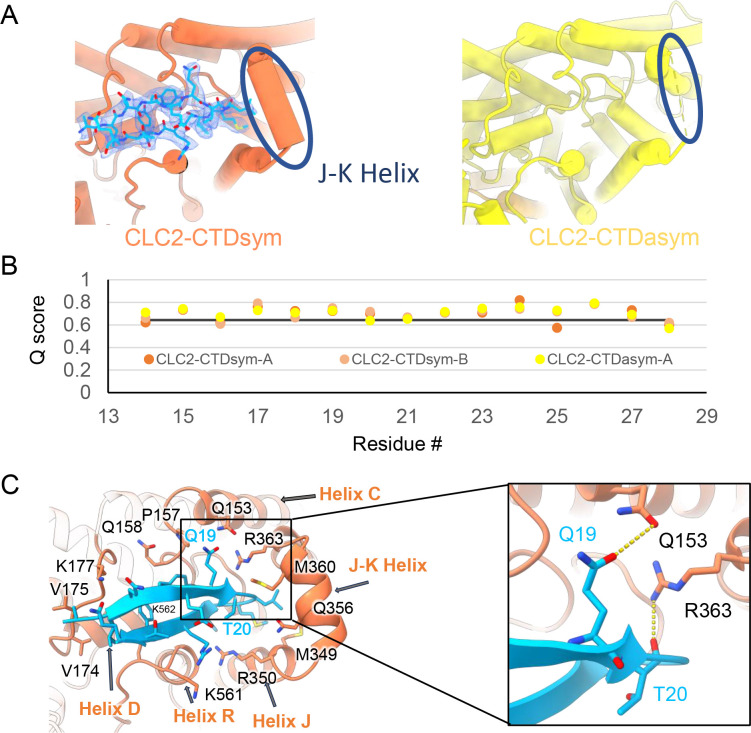
Figure 5.

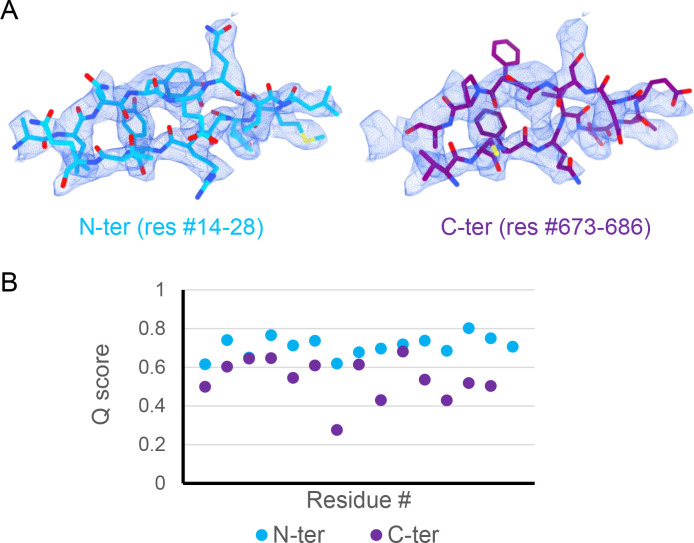
Figure 5—figure supplement 1. Comparison of peptide candidates fitting into the hairpin density.

Figure 5—figure supplement 1.

(A) Best-fitting peptide candidate from the N-terminus (left shown in blue) and from the C-terminus (right shown in purple) fitted into cryoEM hairpin density (blue mesh). (B) Q-score plot of the two peptide candidates (residues 1–15 of the respective sequences). The Q-scores for the C-terminal peptide are generally lower than the Q-score expected for the corresponding resolution (0.65).
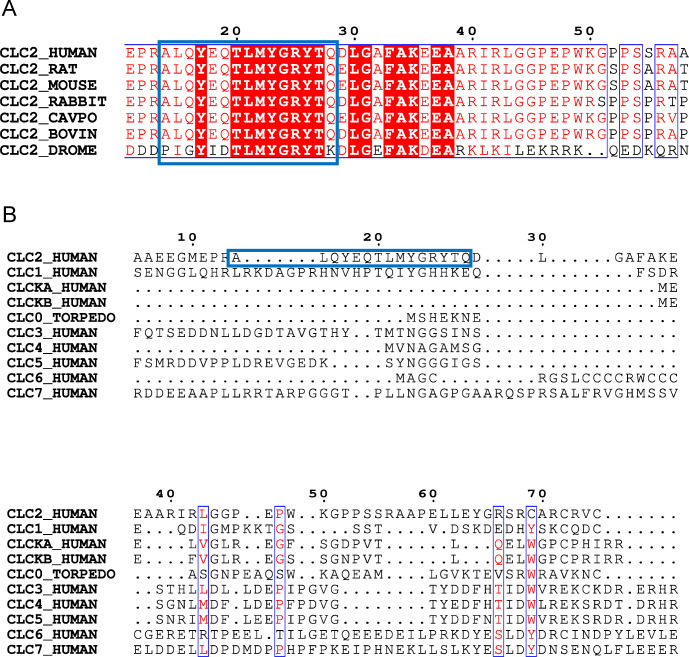
Figure 5—figure supplement 2. N-terminal hairpin sequence is conserved in CLC-2, but not other CLCs.

Figure 5—figure supplement 2.

(A) Alignment of the N-terminal hairpin sequence (blue boxed) among different species. (B) Alignment of N-terminal hairpin sequence (blue boxed) among other human CLCs.
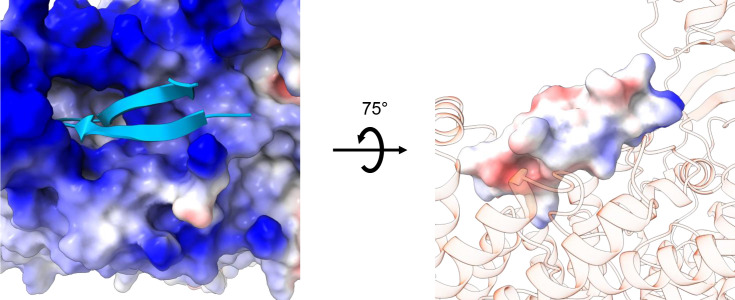
Figure 5—figure supplement 3. Electrostatic map of the N-terminal hairpin-blocking site.

Figure 5—figure supplement 3.

Left: View from the cytoplasm showing the electrostatic surface potential of the transmembrane (TM) region (blue, positive; red, negative), with the hairpin shown in cartoon. Right: Side view showing the electrostatic surface potential of the hairpin (blue, positive; red, negative) and the TM blocking site shown in transparent cartoon model.
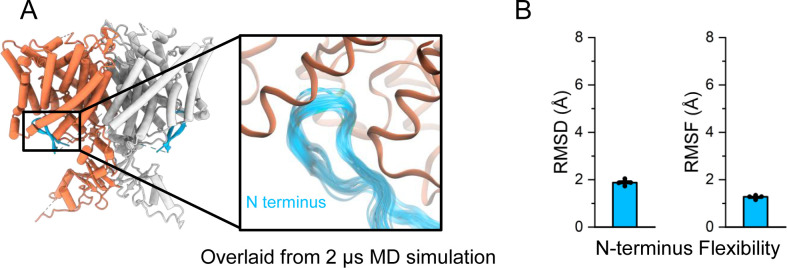
Figure 5—figure supplement 4. Molecular dynamics (MD) simulations confirm the N-terminal hairpin structure is stable.

Figure 5—figure supplement 4.

(A) In simulations, the N-terminus (blue) remains stably bound to the intracellular side of the transmembrane domain (orange). In the inset image, frames of the N-terminus taken every 200 ns from a representative simulation are overlaid. (B) The root-mean-square deviation (RMSD) and root-mean-square fluctuation (RMSF) of the N-terminus backbone were calculated after aligning frames on the transmembrane domains. Bars show the mean of five independent simulations, each 2.0 μs in length. Error bars are 68% CI (confidence interval of the mean).
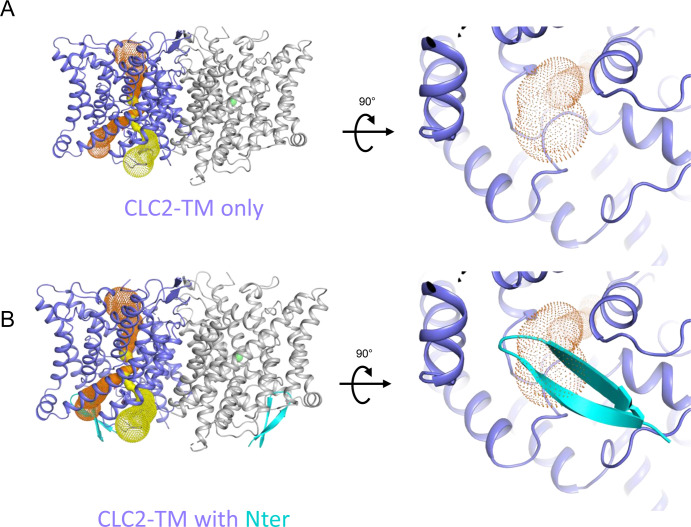
Figure 5—figure supplement 5. The N-terminal hairpin blocks the primary Cl pore in CLC-2.

Figure 5—figure supplement 5.

(A) Left: Side view of CLC2-TM showing the caver-detected pore (primary in orange and secondary in yellow). Right: View of the primary pore from the intracellular side. (B) The N-terminal hairpin (blue) overlaid with CLC2-TM as shown in panel A.
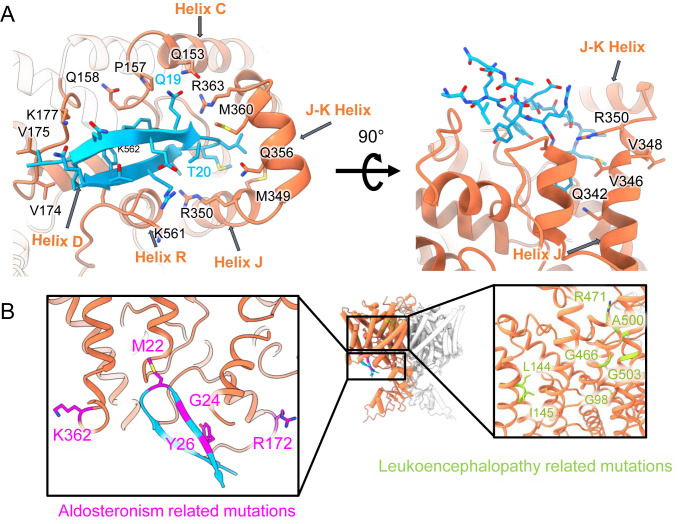
Figure 5—figure supplement 6. Mapping mutant data onto the cryoEM structure.

Figure 5—figure supplement 6.

(A) Left: Same as Figure 5C, showing hairpin interactions. Right: Rotated view highlighting ball ‘receptor’ residues identified by Jordt and Jentsch, 1997. (B) Residues mutated in human Aldosteronism (Fernandes-Rosa et al., 2018; Scholl et al., 2018) and Leukoencephalopathy (Gaitán-Peñas et al., 2017) are shown on CLC2-CTDsym in magenta and green, respectively.