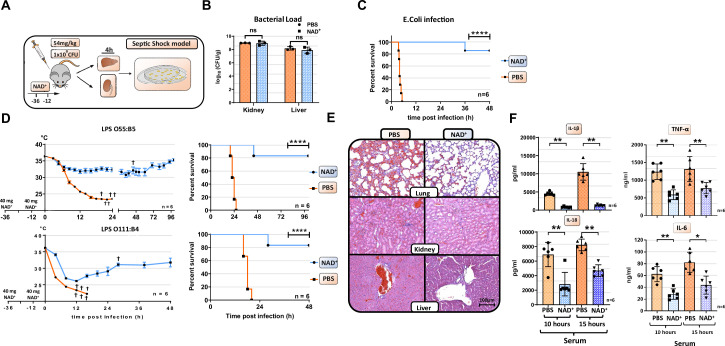
Figure 1. NAD+ protects mice from lethal bacterial infection and endotoxic shock by dampening systemic inflammation.
(A) Mice were treated with PBS or NAD+ prior to administration of a lethal dose of either pathogenic E. coli or lipopolysaccharide (LPS) by intraperitoneal injection. (B) After the death of each animal, lungs, kidney and livers were removed and bacterial load was determined by counting colony-forming unit (CFU). Column plots display mean with standard deviation (n=3). (C) Survival was monitored over 48 hr after bacterial infection and (D) LPS injection of both serotypes (n=6, 3 independent survival experiments). In addition, body temperature was monitored in the kinetics of up to 100 hr. (E) Lungs, kidneys, and livers were removed and IHC was performed for hematoxylin and eosin (H&E) staining. (F) Systemic levels (serum) of IL-6, TNFα, IL-1β, and IL-18 were assessed by ELISA. Column plots display mean with standard deviation (n=5). Statistical significance was determined by using Student’s t-test or one-way ANOVA while survival data were compared using log-rank Mantel-Cox test. Asterisks indicate p-values *=p<0.05, **=p<0.01, and ***=p<0.001, only significant values are shown. All data depicted in this figure are provided as source data.
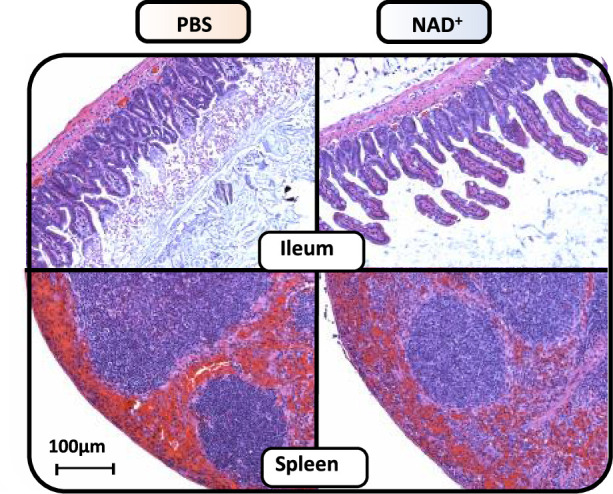
Figure 1—figure supplement 1. NAD+ preserves ileal villi structure and reduces splenic hemorrhage during lipopolysaccharide (LPS)-induced septic shock.

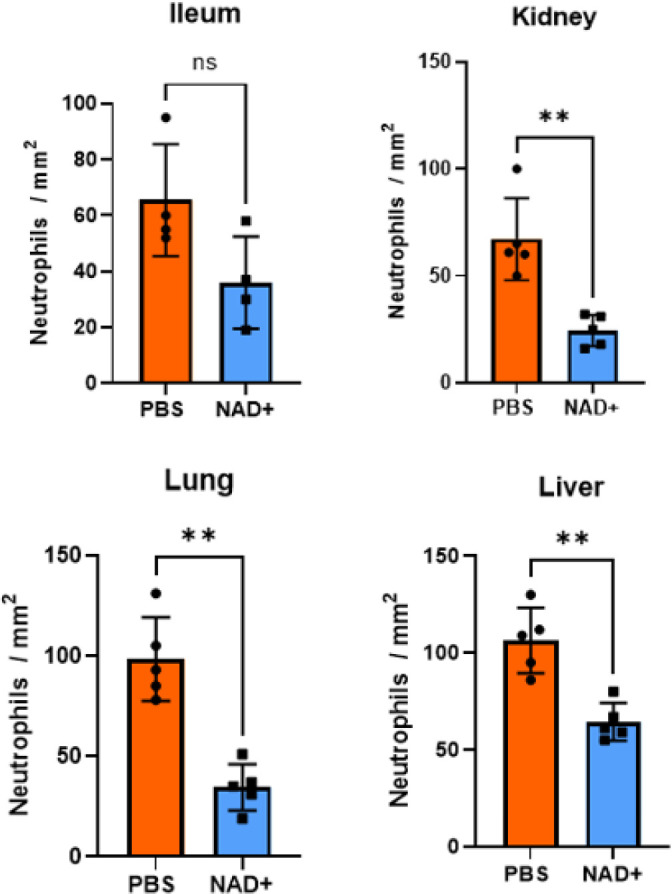
Figure 1—figure supplement 2. Neutrophils per mm2 infiltrating mice: ileum, kidney, lung, and liver in the IHC stains.


