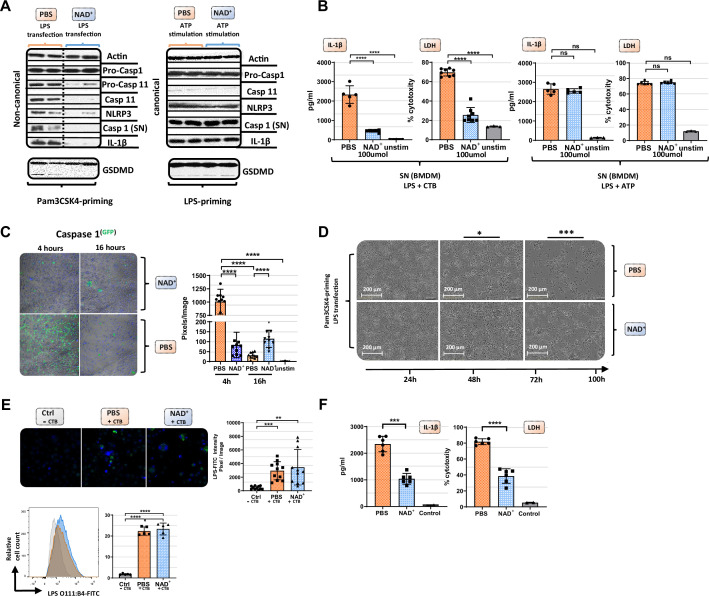
Figure 2. NAD+ specifically inhibits the non-canonical inflammasome by targeting caspase-11.
Bone marrow was isolated from mice and bone marrow-derived macrophages (BMDMs) were differentiated in vitro. Subsequently, BMDMs were cultured in the presence of NAD+ or PBS. BMDMs were then primed with either Pam3CSK4 or lipopolysaccharide (LPS) O111:B4. Next primed BMDMs were stimulated with ATP or LPS and cholera toxin B (CTB). (A) Pro-casp-1, pro-casp-11, casp-11, NLRP3, casp-1, IL1β, and gasdermin D (GSDMD) expression were determined using western blot and (B) IL-1β secretion and LDH release were assessed in the supernatant. Column plots display mean with standard deviation (n=5-8). (C) Time-dependent caspase-1 expression was determined via active staining and assessed using a confocal microscope. Column plots display mean with standard deviation (n=5) (D) Cell viability and apoptosis were monitored using the IncuCyte live microscopy system. (E) LPS transfection with CTB was visualized by using FITC-coupled LPS and DAPI staining and quantified by confocal microscopy and flow cytometry. Column plots display mean with standard deiation (n=6) (F) For human experiments macrophages were differentiated from PBMC, primed with Pam3CSK4 and subsequently transfected with LPS and 0.25% Fugene HD Plus. Column plots display mean with standard deviation (n=6). Statistical significance was determined by using Student’s t-test or one-way ANOVA. Asterisks indicate p-values *=p<0.05, **=p<0.01, and ***=p<0.001, only significant values are shown. All data depicted in this figure are provided as source data.
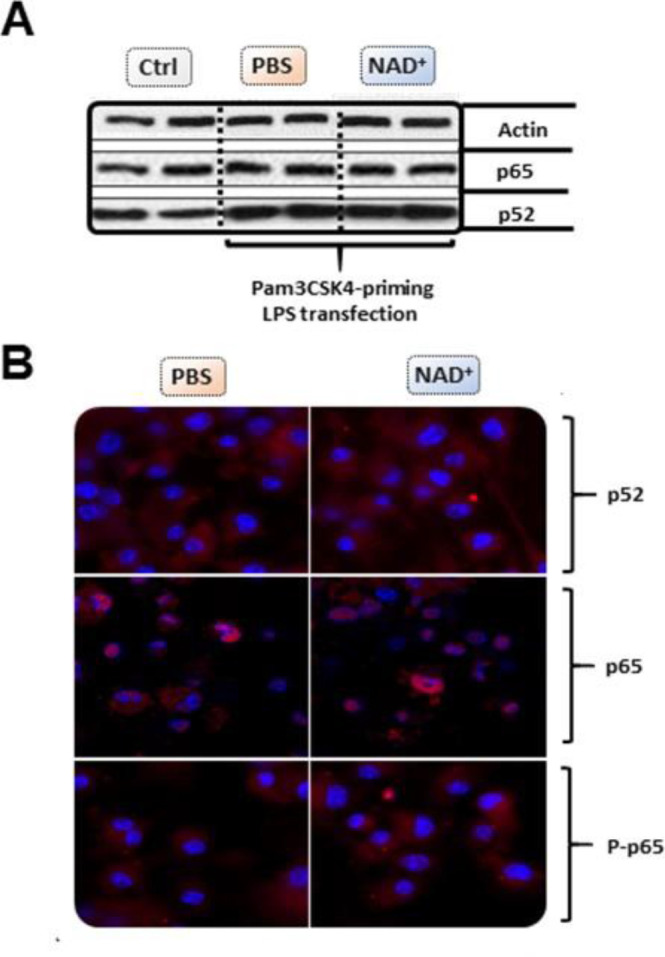
Figure 2—figure supplement 1. NAD+ does not alter bone marrow-derived macrophage (BMDM)-derived NF-κB expression or phosphorylation.


