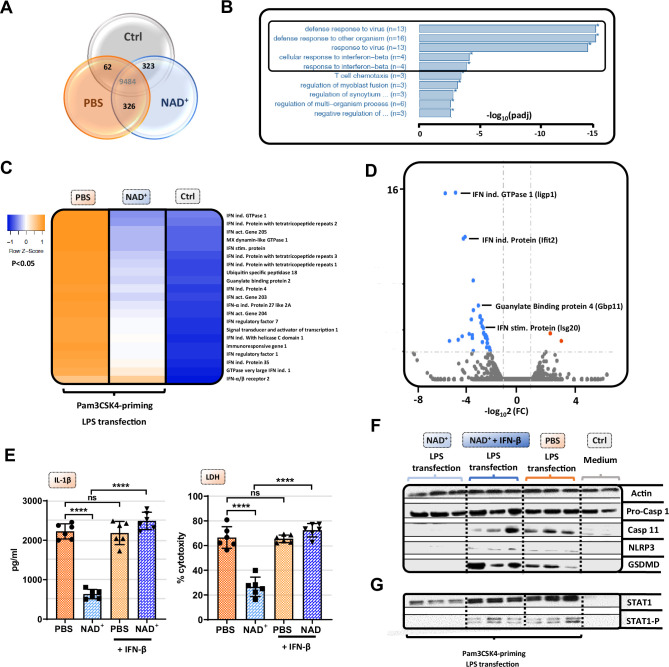
Figure 3. NAD+-mediated inhibition of the non-canonical inflammasome is based on an impaired response to IFN-β.
Differentiated bone marrow-derived macrophages (BMDMs) were cultured in the presence of NAD+ or PBS. BMDMs were then primed with Pam3CSK4, subsequently stimulated with lipopolysaccharide (LPS) and cholera toxin B (CTB) and RNA-sequencing was performed. Unstimulated BMDMs served as controls. (A) Venn diagram plotting common gene expression between all three groups. (B) Gene ontology enrichment analysis displaying the highest significant pathways differing when comparing NAD+ and PBS-treated BMDMs. (C) Expression cluster analysis of genes involved in IFN-β signaling through cluster analysis depicted in a heat map. (D) Volcano plot displaying the most significant genes up- or downregulated comparing NAD+ and PBS-treated BMDMs. (E) Stimulated BMDMs were additionally treated with recombinant INF-β, and IL-1β and LDH release were measured. Column plots display mean with standard deviation (n=6) (F) Moreover, pro-casp-1, casp-11, NLRP3, gasdermin D (GSDMD), (G) signal transducer activator of transcription-1 (STAT-1), and phospho-STAT-1 expression were assessed by western blot. Statistical significance was determined by using Student’s t-test or one-way ANOVA. Asterisks indicate p-values *=p<0.05, **=p<0.01, and ***=p<0.001, only significant values are shown. All data depicted in this figure are provided as source data.

