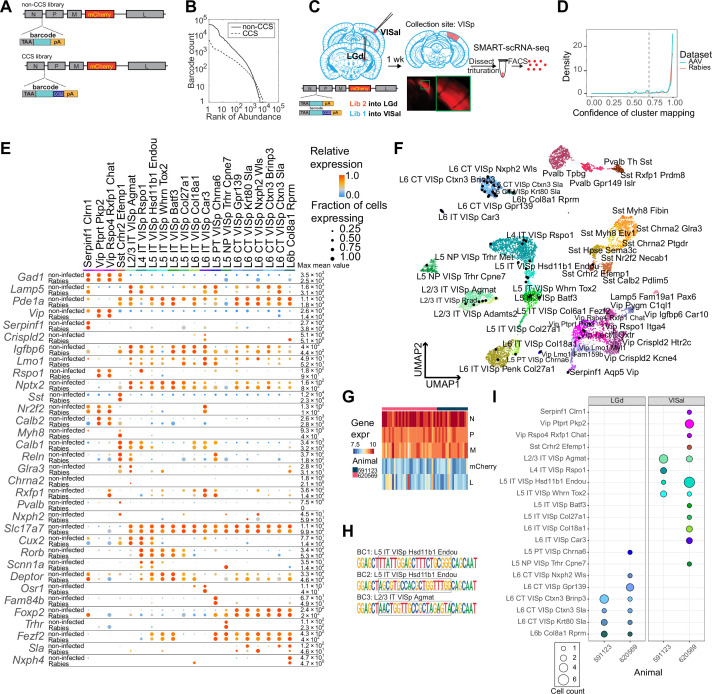
Figure 2. High-quality cell typing of rabies virus-barcoded neurons using single-cell RNA-seq.
(A) Illustration of the design of barcoded rabies virus libraries. (B) Barcode distribution in the CCS and non-CCS libraries. The y axis indicates the count of barcodes, which are sorted in descending order. The rank of the barcode is shown on the x axis. (C) An outline of the experiments. The two libraries are injected into VISal and LGd. After a week, VISp is dissected, and the mCherry-expressing cells are FACS-enriched and processed for single-cell RNA-seq. (D) Histogram showing the cluster mapping confidence of rabies-labeled cells from this study and AAV-labeled cells from Graybuck et al., 2021. (E) The expression of select marker gene in non-infected cells from Tasic et al., 2018 and in rabies-infected cells of matching cell types. Dot size indicates the proportion of cells with non-zero marker expression, and colors indicate relative gene expression levels scaled per row. (F) UMAP plot of gene expression patterns of cells infected with rabies virus (black) overlaid on non-infected cells from Tasic et al., 2018. The non-infected cells are color-coded by cluster identities and cluster names are indicated. (G) The expression of rabies-encoded genes in the sequenced cells. Columns indicate cells and rows indicate genes. Colors indicate the log transformed count for each rabies-encoded gene after scaling by the sum of all reads that mapped to viral constructs multiplied by 10,000. The bar on top indicates donor animals. (H) Example barcode sequences in three sequenced cells. Letter heights indicate probabilities at each position. Gray boxes indicate the barcode region. (I) Distribution of cell types of retrogradely labeled cells. Colors indicate cell types and match those in (F), and dot size indicates the number of cells. VISp, primary visual cortex; VISal, anterolateral visual cortex; LGd, dorsal lateral geniculate nucleus.


