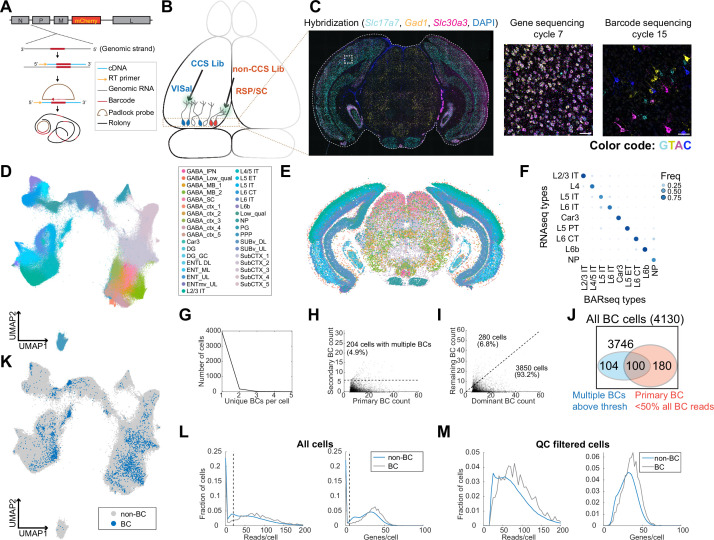
Figure 3. In situ sequencing identifies transcriptomic types of neurons infected with barcoded rabies virus.
(A) Illustration of probe designs and amplification approach for in situ sequencing of rabies barcodes. (B) Illustration of the experiments. The two libraries were injected in VISal and RSP/SC, and coronal sections from the boxed area were sequenced. Neurons that project to the two injection sites would be labeled with different sets of barcodes, as indicated by different colors. (C) Left, example image of a coronal section (outlined by a dashed line) during the hybridization cycle. The final sequencing cycles for genes and barcodes in the boxed area are shown on the right. The gene or nucleotide that corresponds to each color is indicated. Scale bars=50 µm. See Supplementary Tabel 3 for a list of genes interrogated. (D-E) All sequenced cells shown on a UMAP plot of their gene expression patterns (D) or on a representative coronal section (E). Colors indicate subclass-level cluster labels as shown in the legend. (F) Cluster matching between BARseq subclass-level clusters and subclasses from scRNA-seq (Tasic et al., 2018). Dot size and colors indicate the frequency that neurons from a BARseq cluster are assigned to a reference scRNA-seq cluster. (G) The number of cells (y axis) with the indicated number of barcodes per cell (x axis). (H) The count of the primary barcode (x axis) and the count of the second most abundant barcode (y axis) in each barcoded cell. Cells above the dotted line are considered as having more than one barcode per cell. (I) Counts of the most dominant barcode (x axis) and the remaining barcodes (y axis) in each cell. (J) Summary of the number of cells with more than one barcodes (blue) and/or cells in which the primary barcodes accounted for less than half of all barcode reads (red). The shapes are not drawn to scale. (K) UMAP plot as plotted in (D), color coded by whether the cells had barcodes. (L-M) Histograms showing the distribution of endogenous mRNA reads per cell and unique gene counts per cell in all cells (L) or the QC-filtered cells (M). In (L), the dotted vertical lines indicate QC thresholds. BC, Barcoded cells; VISal, anterolateral visual cortex; RSP, retrosplenial cortex; SC, superior colliculus.

