. 2024 Feb 26;12:RP89465. doi: 10.7554/eLife.89465

Figure 2. Shear induces nanoscopic movement of TREK-1 in HEK293T cells.

(A) Schematic representation of the shear fixing protocol. Cells grown in a shear chamber are fixed while shear force is applied. Fixed samples are then labeled with fluorescent antibodies or CTxB and subjected to imaging for nanoscopic movement (<250 nm) by two-color super-resolution imaging and pair correlation (Pair corr.). (B) EGFP-STORM imaging of TREK-1:EGFP and Alexa 647 cholera toxin B (CTxB) with and without shear in HEK293T cells. The middle panel, outlined in gray, is a zoomed portion of the cell surface outlined in the top panel. The bottom panel is a zoomed portion of the cell surface from a cell treated with shear (see Figure 2—figure supplement 1I for full image). Locations of TREK-1/GM1 proximity are outlined with a white circle. (C) Pair correlation analysis (Pair corr.) of TREK-1 with GM1 lipids before and after shear (3 dynes/cm2; green) determined by EGFP-STORM imaging when mouse phospholipase D2 (mPLD2) is overexpressed (non-permeabilized). The significance of the Pair corr. change is shown across the range of radii 50–70 nm (along the curve) and at a single 50 nm radius (inset). (D) Combined EGFP-STORM imaging of TREK-1 with Alexa 647-labeled PIP2 in the presence of overexpressed mPLD2 (permeabilized). Significance is shown for radii 70–85 nm along the curve and at a single 225 nm radius (inset). (E, F) Combined EGFP-STORM of TREK-1 in the presence of catalytically inactive PLD2 (xPLD2). Shear (3 dynes/cm2) of TREK-1 is shown as a red curve with xPLD2 present. The experiments are as described in panels (C) and (D). In (E) a significant shift in TREK-1/GM1 Pair corr. is shown for 50–70 nm (along the curve) and at a 50 nm radius (inset). In (F) Pair corr. did not appear to shift significantly, as determined by a Student’s t-test or for multiple point a nested Student’s t-test; *p<0.05, **p<0.01, ***p<0.001, ****p<0.0001. (G) Cartoon illustrating the association of TREK-1 with GM1 lipids prior to shear (top) and with PIP2 lipids (bottom) in response to mechanical shear (red arrow).

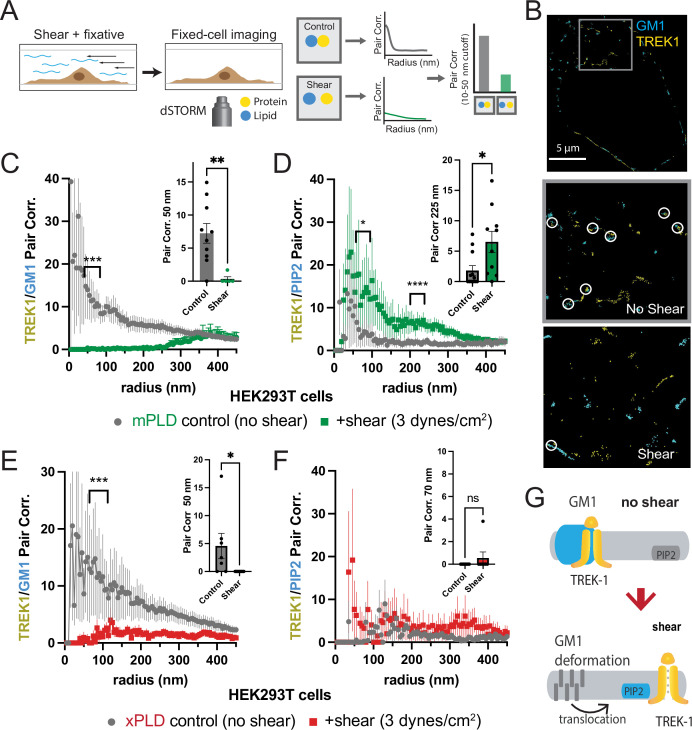
Figure 2.

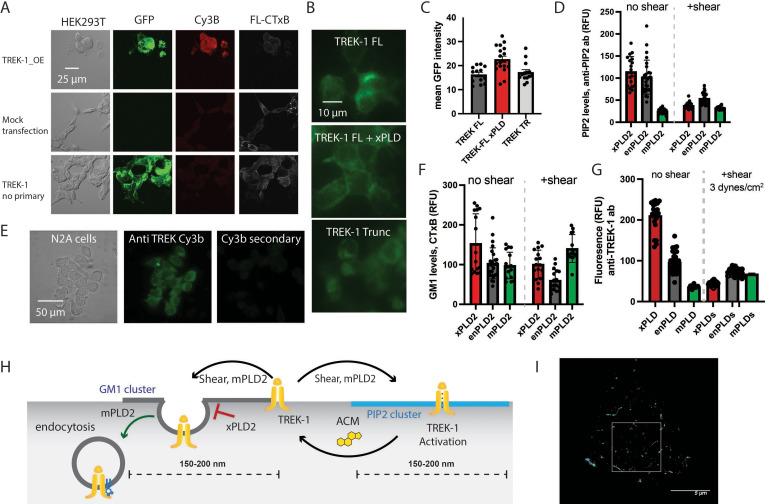
Figure 2—figure supplement 1. Expression and staining of TREK-1 in cell culture.

Figure 2—figure supplement 1.

(A) Confocal images of HEK293T cells overexpressing human TREK-1 tagged with EGFP. The cells were fixed and stained with anti-TREK antibody, a secondary cy3b antibody (red) and A647 conjugated cholesterol toxin B (CTxB, gray) to label lipids. In the absence of transfection, no GFP signal is observed. A negative control, lacking the primary antibody, exhibits no fluorescence. (B) Visualization of TREK-1 overexpression in HEK293T cells prepared identical to the cells used for ecophysiology experiments in Figure 1. (C) Overexpression of catalytically inactive PLD2 (xPLD) appears to enhance TREK-1 expression. Truncating the c-terminus (TREK trunc) has no discernible effect on expression TREK-1 at the plasma membrane. (D) Shear and overexpression of mPLD2 reduce PIP2 levels on the plasma membrane. (E) Immunostaining of endogenous TREK-1 in neuroblastoma 2a (N2a) cells. (F) Both mPLD2 overexpression and shear dramatically reduced the amount of GM1 observed by fluorescent staining with cholera toxin B (CTxB). (G) Assessment of the impact of shear on TREK-1 levels in HEK293T cells. These cells were transfected with full-length TREK-1 (TREK FL) and either xPLD2 or mPLD2. After 24 hr, the cells were subjected to 3 dynes/cm2 rotary shear and fixed. Both PLD2 overexpression and shear resulted in a reduction of TREK-1 expression, likely due to endocytosis processes. (H) Cartoon illustrating the role of shear, PLD2, xPLD, in endocytosis. Shear and mPLD2 both activate TREK-1 and decrease TREK-1 surface levels. Presumably the decrease is due to endocytosis since mPLD2 and shear are known to increase endocytosis and xPLD2 is known to block endocytosis. (I) dSTORM images showcasing sheared HEK293T cells expressing TREK-1. The image corresponds to the cell depicted in Figure 2B. The highlighted box represents an expanded region of this image.
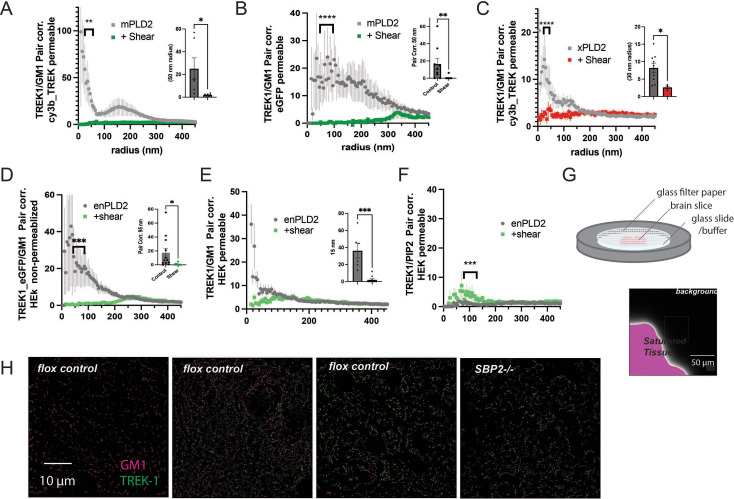
Figure 2—figure supplement 2. Comparisons of labeling type and permeabilization.

Figure 2—figure supplement 2.

(A) Two-color dSTORM using a Cy3b-labeled TREK-1 antibody after mechanical shear in the presence of overexpressed mouse PLD2 (mPLD2) and full-length human TREK-1. HEK293T cells were fixed, permeabilized, and stained with a Cy3b-conjugated anti-TREK-1 antibody. Pair correlation (Pair corr.) analysis of TREK-1 with alexa-647-conjugated cholera toxin B (CTxB) was conducted via dSTORM, revealing a decrease in Pair corr. with 3 dynes/cm2 orbital fluid shear. (B) Similar experiments as in panel (A), but with Pair corr. analysis from EGFP, which was C-terminally expressed with TREK-1 instead of using a Cy3b-labeled anti-TREK-1 antibody. The use of EGFP in dSTORM buffers resulted in a robust dSTORM signal. This dataset also offers a direct comparison between permeabilized and non-permeabilized cells in Figure 2B. Pair correlation of TREK-1 with GM1 showed dramatic decreased under three different conditions. (C) A comparison of Cy3b-STORM with EGFP-STORM as observed in Figure 2E in the presence of xPLD2. (D, E) A comparison between non-permeabilized (a) and permeabilized (b) HEK293T cells overexpressing full-length human TREK-1 (TREK FL) and endogenous PLD2 (enPLD2), that is, without PLD2 overexpression. Taken from Call et al., 2023. (F) Pair correlation between TREK-1 and PIP2 increased slightly after mechanical shear. Insets in (A–D) illustrate the variability at a single radius. Statistical analysis for single points was conducted using a Student’s t-test, while statistical comparisons at multiple radii were performed with a nested Student’s t-test. (G) Schematic representation of brain slices prepared for dSTORM. Mouse brains, fixed through whole-body perfusion, were sliced and labeled with Cy3b-anti-TREK-1 antibody and A647 CTxB. These slices were mounted on a cover slip with fiberglass filter paper on top to secure the tissue during imaging with dSTORM buffer added to the filter paper. The fluorescent background (640 nm) was undetectable even at saturating light intensities. (H) Example images of brain slices from control and astrocyte-specific SREBP2 null mice. TREK-1 was expressed in most brain regions but not uniformly (left panel). Pair correlation analysis was performed on regions with both TREK-1 and CTxB labeling. The displayed slice is a coronal section near the hippocampus, although the precise region of interest is unspecified. Significance was determined by a Student’s t-test for a single point. For multiple points, a nested Student’s t-test was used (*p<0.05, ** p<0.01, *** p<0.001, ****p<0.0001).