. 2024 Feb 26;12:RP89465. doi: 10.7554/eLife.89465

Figure 3. Shear mobilizes PLD2 within ordered GM1 lipids.

(A) Two-color dSTORM images of fixed C2C12 cells with and without (3 dynes/cm2) shear. Cells were labeled with fluorescent CTxB (ganglioside GM1) or antibodies (anti-PIP2 or anti-PLD2 as indicated) and sheared with the temperature held constant at 37℃. Scale bar = 1 µm. (B) Pair correlation analysis (Pair corr., unitless) of PLD2 with GM1 or PIP2 lipids at a given radius. Error bars are displayed at a given radius. A bar graph (inset) is shown at the shortest calculated radius of 5 nm (single point on the x-axis). Prior to shear (gray line), PLD2 associates with GM1 clusters; after shear, there is almost no association. (C) The opposite was true for phosphatidylinositol 4,5 bisphosphate (PIP2). Prior to shear, PLD2 does not associated significantly with PIP2 clusters, after shear, its association increases dramatically. (D) Cluster analysis of the GM1 lipids from the C2C12 cells shown in (A). (E) Cluster analysis of GM1 lipids in neuroblastoma 2a (N2a) after 3 dynes/cm2 shear force. (F) Fluorescent cholesterol assay. N2a cells grown in 48-well plates were sheared with 3 dynes/cm2 orbital fluid shear, fixed with shear (10 min), and compared to control cells with no shear using a fluorescent cholesterol assay. After shear, a second set of control cells were allowed to recover with no shear and fixative for 30 s (recovery), otherwise the cells were treated identical to experimental cells (n = 5–10). (G) A live PLD activity assay demonstrates that fluid shear (3 dynes/cm2) increases substrate hydrolysis in cultured N2a cells (n > 800 clusters from 5 to 6 cells). (H) Depiction of shear thinning activating PLD2. Left: the palmitates of PLD2 (green lines) are shown bound to the palmitate site in ordered GM1 lipids. Right: after shear cholesterol is reduced, and GM1 lipids are deformed. The deformed surface no longer binds palmitates efficiently allowing the palmitates move freely—a process known as shear thinning. Statistical comparisons were made with an unpaired Student’s t-test (*p<0.05, ***p<0.001, ****p<0.0001).

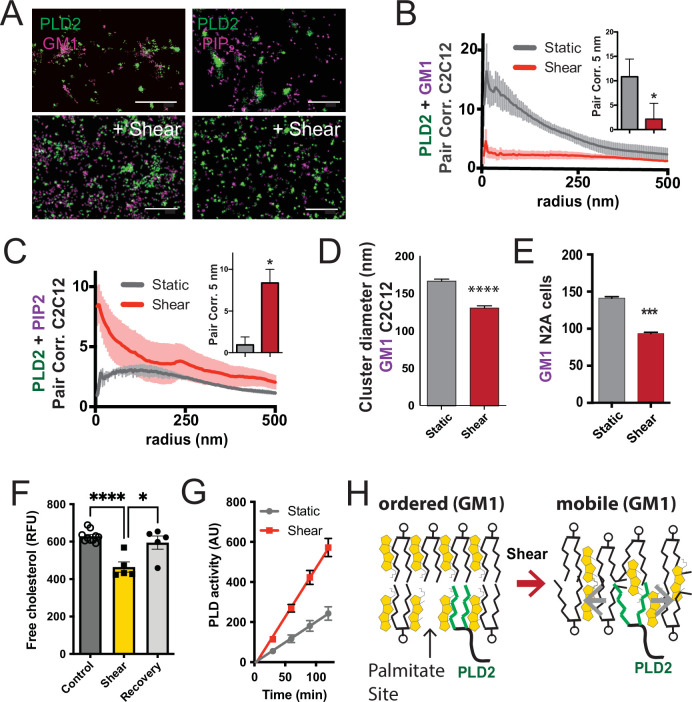
Figure 3.

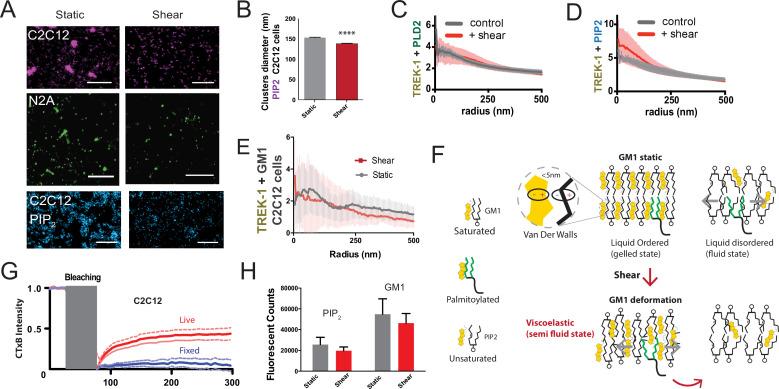
Figure 3—figure supplement 1. Observing cellular changes in response to mechanical stimulation.

Figure 3—figure supplement 1.

(A) Representative images illustrating the impact of shear on the apparent size of GM1 (maroon and green) in muscle C2C12 and neuronal N2a cells, respectively. PIP2 clusters in C2C12 cells are shown in blue. When shear force is applied, the apparent size decreases. Scale bars = 1 µm. (B) Cluster analysis of PIP2 demonstrates a small but statistically significant decrease in size. (C) Complex formation between TREK-1 and PLD2 before and after shear in C2C12 cells. Pair correlations analysis of TREK-1 and PLD2 before (gray line) and after (red line) 3 dynes/cm2 shear. Their association remains almost identical in both states. (D) Staining of TREK-1 with phosphatidylinositol 4,5 bisphosphate (PIP2) antibody in C2C12 cells. Before shear (gray line) TREK-1 exhibits significant association with PIP2. After shear, this association further enhanced, suggesting some TREK-1 complexes move to PIP2 clusters in C2C12 cells. (E) Pair corr. of TREK-1 with GM1 clusters (CTxB) measured by dSTORM in C2C12 cells prior to cholesterol loading, as shown in Figure 4B. In the low cholesterol state, endogenous TREK-1 shows minimal association with GM1 lipids. (F) Shear thinning model for PLD2. Cholesterol is depicted as packing with saturated lipids and saturated palmitate via Van der Waals interactions (within 5 nm). Unsaturated lipids contain a double bond that alters the packing surface of a lipid. In a perfectly ordered state, palmitoylated proteins are ordered with the GM1 lipids and cholesterol. In the disordered region, palmitates move fluidly within the membrane. After shear, the GM1 lipids remain ordered but deformed. The palmitates no longer efficiently pack with the GM1 lipids, reducing their affinity for the ordered domain and allowing the palmitates to move in the membrane. (G) Fluorescence recovery after photobleaching (FRAP) imaging to examine potential labeling artifacts (Moon et al., 2017; Raghunathan and Kenworthy, 2018; Wang et al., 2018) of pentavalent CTxB that might persist after fixation. The duration of photo bleaching is indicated in gray. The blue line shows that fixation with paraformaldehyde (PFA) and glutaraldehyde effectively restricts the large-scale movement of lipids in fixed cells compared to live cells (red). (H) For both PIP2 and GM1 labeling, shear did not significantly decrease the overall counts measured with dSTORM in C2C12 cells (p>0.05, Student’s t-test).