. 2024 Feb 26;12:RP89968. doi: 10.7554/eLife.89968

Figure 1. Wingbeat-resolved aerodynamic forces, pectoralis activation and contraction, and 3D surface reconstruction of four doves (N = 4) in slow hovering flight (n = 5).

(A) Inset showing the average second wingbeat (N × n = 20 flights total) net horizontal (x, purple) and vertical (z, orange) aerodynamic force, electrical activation (EMG, pink) of the left pectoralis (right pectoralis signal was unreliable), and strain of the left (pink) and right (blue) pectoralis. Gray region: downstroke; color shaded regions: standard deviation; force normalized by bodyweight: bw; statistics and plot definitions apply to all figures unless stated differently. At the top is shown a dove’s 3D reconstructed surface and recorded aerodynamic force during each stroke phase (flight direction mirrored to match temporal direction). (B) The same data from (A) are plotted for a single representative flight from takeoff to landing. The dotted lines represent horizontal and vertical perch forces during takeoff and landing. In addition to the lowpass filtered (pink) EMG signal, the raw signal is plotted in black. (C) The total 3D aerodynamic force (Fwing, black) is the sum of the measured horizontal (x) and vertical (z) components (Fwing,x,z, gray) combined with the computed lateral (y) component (dotted line connecting Fwing and Fwing,x,z). Using the 3D surface model (depicted at 17% of the second wingbeat), we illustrate the reconstruction of drag (D, red) and lift (L, blue) based on drag pointing opposite to wing velocity (vaero, black) and being perpendicular to lift. Drag and lift act perpendicular to the vector connecting the shoulder joint to the ninth primary wingtip (XP9). Along this vector, the mass of the wing is discretized using 20 point masses (green spheres; volume proportional to mass). Twelve body landmarks were manually tracked; black dots: ninth primary wingtip (XP9), seventh secondary feather, shoulder joint, wrist; gray dots: middle of the back (next to shoulder), left and right feet, left and right eyes, top of the head; gray cone: tip and base of the beak.

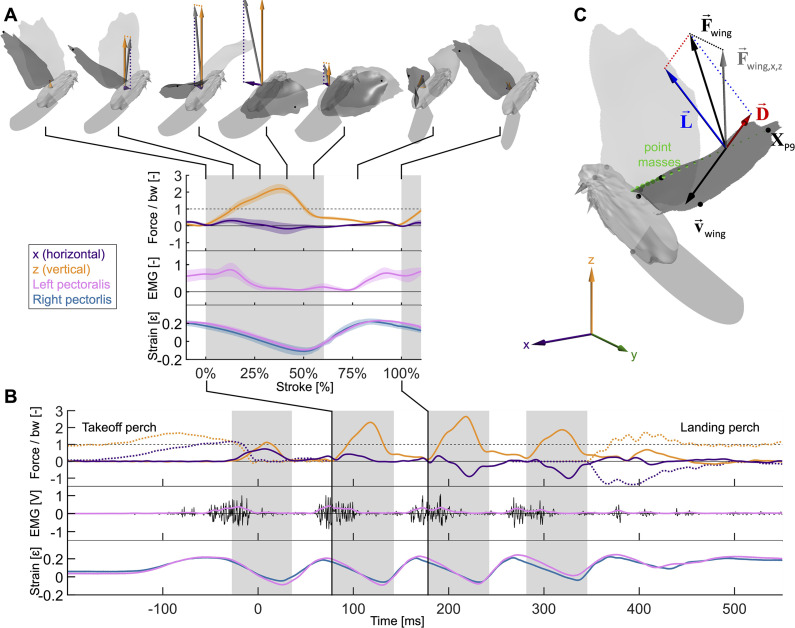
Figure 1.

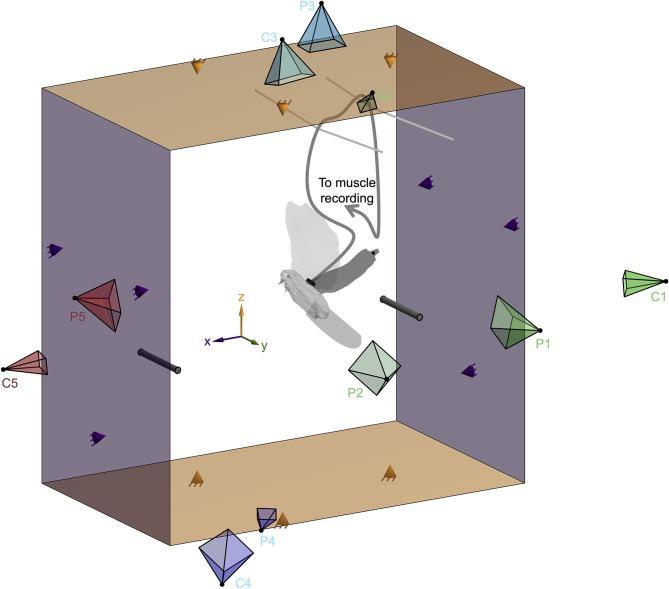
Figure 1—figure supplement 1. Experimental setup. Simultaneous measurement of the electrical activation and strain of the pectoralis muscle, the horizontal and vertical aerodynamic forces, and the 3D wing, body, and tail surface of doves in slow forward flight enabled us to reconstruct the aerodynamic work loop of the pectoralis.

Figure 1—figure supplement 1.

The dove flew from the right perch to the left perch inside the 2D aerodynamic force platform (AFP) (Lentink et al., 2015; Chin and Lentink, 2019; Deetjen et al., 2020; Lentink, 2018; Chin and Lentink, 2020). Force panels above and below the dove (orange) measured the time-resolved vertical aerodynamic force, and panels behind and in front of the dove (purple) measured the time-resolved horizontal aerodynamic force generated by the dove to fly. Each of the four panels was connected in a statically determined manner to three force sensors (orange and purple cones). Five pairs of high-speed cameras (C1–C5; cameras further from the dove appear smaller) and projectors (P1–P5) imaged the body, tail, and left wing of the dove from different view angles during the second stroke after takeoff (Deetjen et al., 2017). We assumed bilateral symmetry for the right wing because we focused our cameras and projectors on the left wing, during the second stroke after takeoff, to optimally resolve the wing’s 3D surface during a full wingbeat. The wire (dark gray curving line) used to measure the electrical activation (electromyography) and strain (sonomicrometry) of the pectoralis muscle was attached to the back plug (black rectangle). The plug was secured to the back by suturing its base to intervertebral ligaments. This wire was loosely supported by strings mounted near the top of the AFP (two light gray lines), exiting the AFP through a small hole in the acrylic side panel (labeled ‘to muscle recording’).

Figure 1—figure supplement 2. Comparison of aerodynamic and perch forces prior to surgery and after surgery shows that the surgery substantially altered the flight performance.

Figure 1—figure supplement 2.

Pre-surgery flights are plotted in green, post-surgery flights without the recoding cable connected to the dove are plotted in yellow, and post-surgery flights with the connected muscle recording cable (EMG and sonomicrometry) are plotted in red. For all three flight scenarios, we averaged five flights from dove 3. Plots show average and standard deviation across five flights; gray region indicates second downstroke after takeoff. (A) The aerodynamic and perch forces across the entire flight (similar to Figure 1B, Figure 1—figure supplement 3). (B) The aerodynamic forces generated by the second wingbeat (similar to Figure 1A) during which we 3D reconstructed the dove’s body surface in flight.

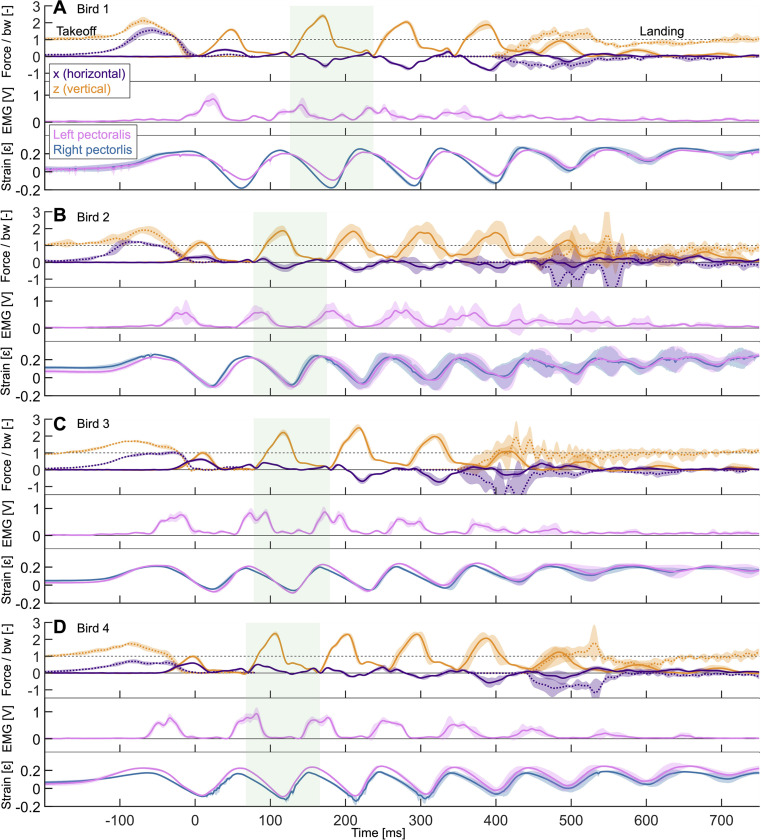
Figure 1—figure supplement 3. Measured data is plotted for each of the four doves individually, averaged over five flights per dove.

Figure 1—figure supplement 3.

Shaded regions: standard deviation. The data plotted is similar to Figure 1B, where data from a single flight was plotted. For each dove, we plot the horizontal (x, purple) and vertical (z, orange) aerodynamic forces (solid lines), the horizontal and vertical takeoff and landing forces (dotted lines), the pectoralis electrical activation (pink: left pectoralis), and the pectoralis strain (pink: left pectoralis; blue: right pectoralis). Manual temporal alignment is based on the instant the dove takes off. All summary figures use data from the second wingbeat after takeoff (green shaded regions). (A) Five averaged flights by dove 1. (B) Five averaged flights by dove 2. (C) Five averaged flights by dove 3. (D) Five averaged flights by dove 4.