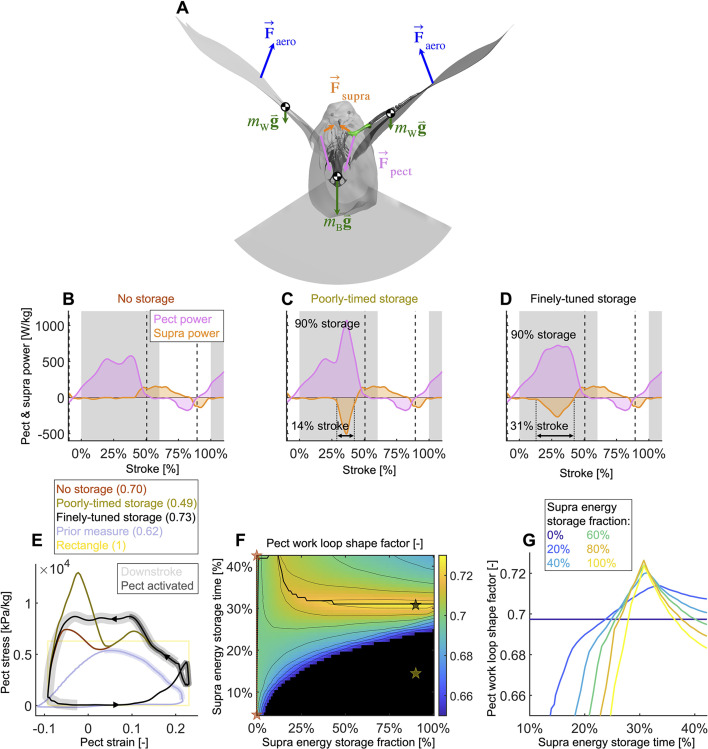
Figure 5. Finely tuned energy storage in the supracoracoideus tendon simplifies the function of both major flight muscles.
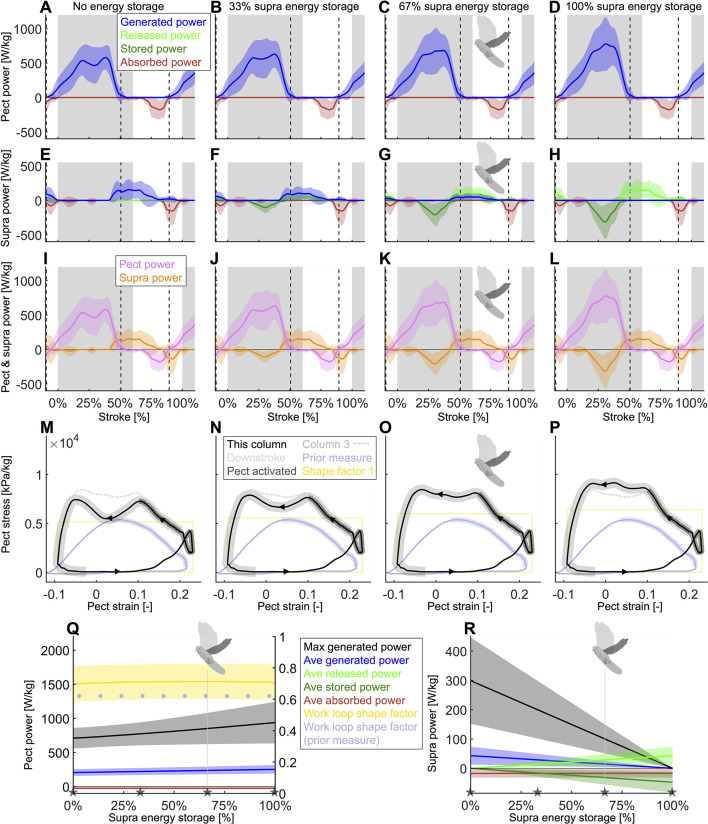
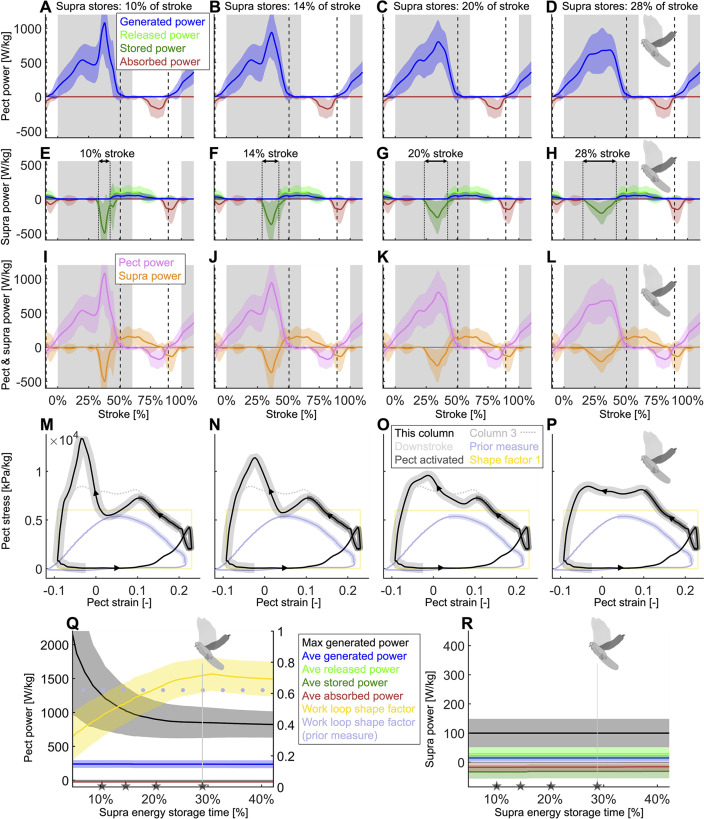
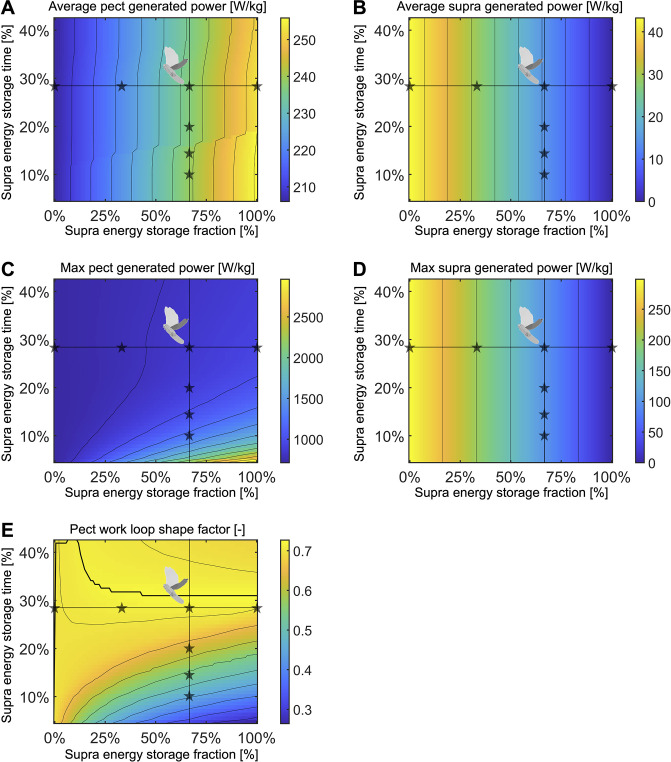
(A) Our power model was derived by combining the external and internal force balance shown with the associated kinematic velocities (not shown); see equations in Figure 7—figure supplement 1. Approximately all internal flight forces and associated power are produced by the two primary flight muscles, the pectoralis (pink; ) and the supracoracoideus (orange; ), which move the mass of the body (green; : modeled as a point mass) and wings (green; : modeled as 20 point masses displayed in Figure 1C) to generate the wings' aerodynamic forces (blue; ) and thus power to sustain flight. (B–D) The pectoralis (pink) generates positive power during the downstroke and acts like a brake to absorb negative power during the late-upstroke (power is normalized by pectoralis mass). The supracoracoideus (orange) generates and/or releases positive power during the upstroke. Any energy released by the supracoracoideus tendon during the upstroke must first be stored during the downstroke, which is plotted as negative power. (B) Without energy storage in the supracoracoideus tendon, there is an unfavorable mid-downstroke dip in the required pectoralis output power. (C) If energy storage is poorly timed during the downstroke, the required pectoralis output power unfavorably spikes. (D) If the timing and quantity of energy storage are finely tuned, the pectoralis work loop is more favorably shaped mid-downstroke as it more closely approximates the theoretically ideal rectangular work loop (yellow rectangle in [E]) (E) The finely tuned elastic storage shown in (D) corresponds with the black work loop and results in the highest pectoralis shape factor (0.73) for the range of elastic storage parameters we simulated in (F), with stars corresponding to the loops in (E). Numbers between parenthesis in [E]: shape factor; dark gray shading: electrical pectoralis activation; light gray shading: downstroke phase. The shape factors of both the no-storage (brown: [B]) and finely tuned storage (black: [D]) cases exceed prior experimental shape factor measurements, of doves flying similarly slow (Tobalske et al., 2003). (G) Work loop shape factor as a function of elastic energy storage timing and fraction (color codes energy storage fraction): see Figure 5—figure supplements 1–3 for a detailed overview.


