. 2024 Feb 26;12:RP89968. doi: 10.7554/eLife.89968

Figure 7. We integrate body morphological and kinematic scaling laws across extant birds with our aerodynamic, inertial, and muscle power measurement for doves to predict how average muscle power and timing should scale.

(A, B) Averaged data from the current study is plotted in red, which is scaled based on extant bird data (other colored lines; power scaled by bodyweight: bw). (C, D) Data from the current study is plotted in green, and scaled extant bird data is plotted in black. Data measured directly in other studies at similar flight speeds (1.23 m/s) are plotted in multiple colors and marker types, which correspond to and are explained in detail in the caption of Figure 7—figure supplement 3. (A, C) The stroke-averaged muscle power scaled by bodyweight is proportional to wingtip velocity and the aerodynamic power scaling parameter, xp,aero. Stroke-averaged pectoralis power data from the literature (fitted with dotted black line) is too scattered to confirm the trendline from our scaling analysis (solid gray line). (B, D) Because wing inertia dominates aerodynamic scaling, the pectoralis needs to activate earlier at larger scale (and vice versa). Hence, the timing of power and force production within the stroke scale according to the ratio of the inertial and aerodynamic power scaling parameters, xp,iner/xp,aero. The colored vertical lines in (B) are plotted at the midway point of pectoralis power exertion (Equation S75). This same midway point is plotted as filled dots in (D) with a solid gray linear-fit line. The midway point of pectoralis force exertion (Equation S76) is plotted as empty dots in (D) with a dashed gray linear-fit line. EMG timing data (colored solid lines with hashes at the start and end; starting points fitted with lower dotted black line) and corresponding peak pectoralis force data (asterisks; fitted with upper dotted black line) from the literature are too scattered to confirm the subtle trendlines from our scaling analysis.

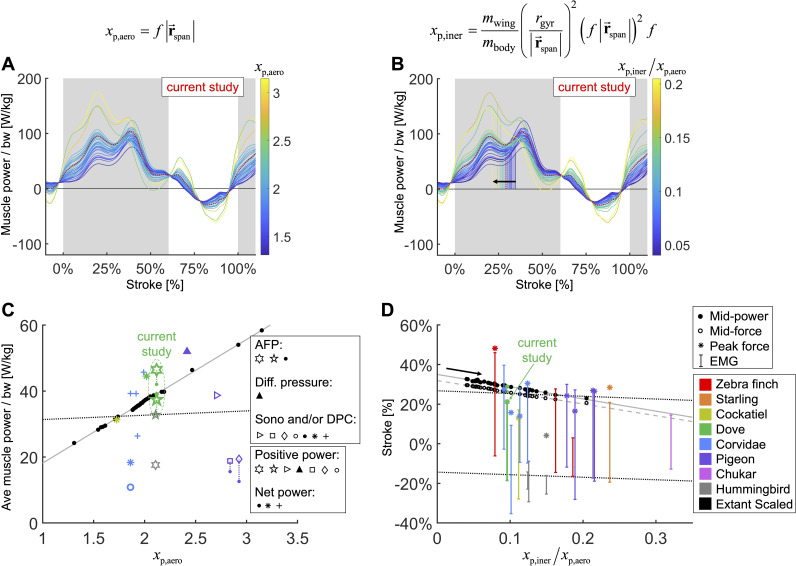
Figure 7.

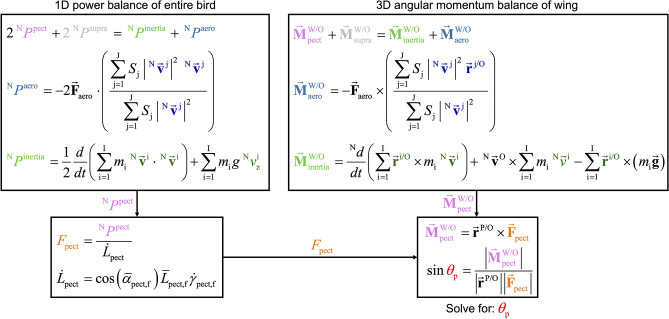
Figure 7—figure supplement 1. The two overarching dynamics balance methods that we use to analyze muscle behavior resolves different information, yet are related in their form and together provide insight into the pull angle of the pectoralis on the humerus.

Figure 7—figure supplement 1.

While the 1D power balance method resolves required muscle power, the 3D angular momentum balance method resolves the 3D direction which the pectoralis pulls on the humerus. However, the two methods are similar in that in each method the muscle quantity (pink text) equals the sum of the aerodynamic quantity (blue text) plus the inertial quantity (green text). In this flow chart, the equations used in the main text to compute the total muscle power and moments are summarized, and their relationship is visualized, culminating in the computation of the pectoralis pull angle, θp (see Figure 6C). The top-left box summarizes the 1D power balance method which results in total muscle power. This can be used to solve for the pectoralis force magnitude, Fpect. The top-right box summarizes the 3D angular momentum balance which results in total muscle moment. Based on the measured distance between the shoulder joint and the deltopectoral crest (rP/O), we can compute the pectoralis pull angle on the humerus.
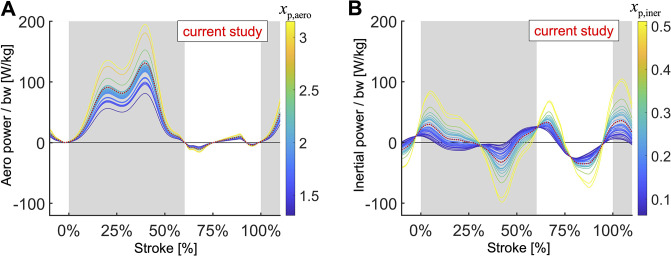
Figure 7—figure supplement 2. Extra detail is added to Figure 7.

Figure 7—figure supplement 2.

(A) Aerodynamic power scaled by bodyweight scales linearly with xp,aero. (B) Inertial power scaled by bodyweight scales linearly with xp,iner.
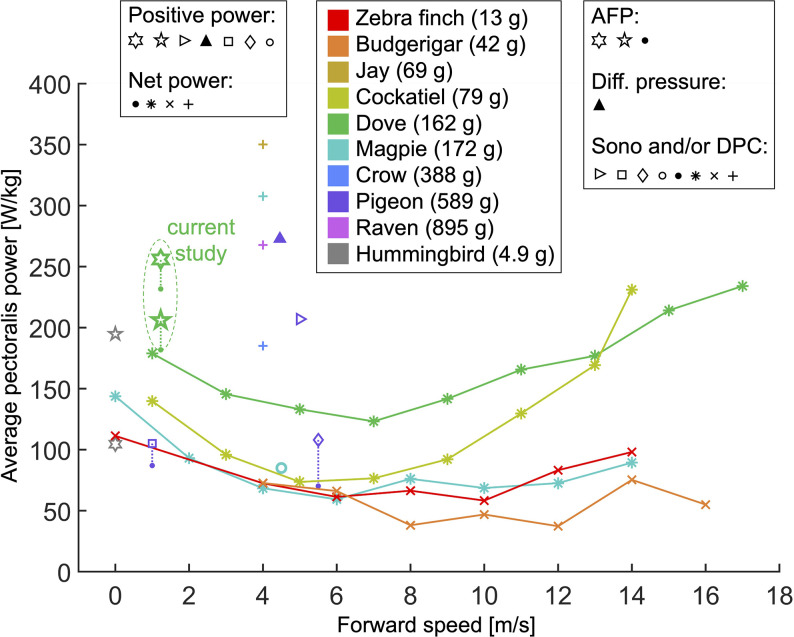
Figure 7—figure supplement 3. We compare our computed stroke-averaged pectoralis power scaled by pectoralis mass with values measured in the literature using a variety of different methods, bird species, and flight speeds during level flight.

Figure 7—figure supplement 3.

The data is scattered, and the current study fits within the range of previous measurements. The type of bird corresponds with the color as labeled in the legend and follows rainbow order from the lightest (red) to the heaviest (pink). Each study corresponds to a different marker type, which can be grouped in the following manner: (1) closed-border shapes (☆, ▷,▴,☐, ◇,◦) indicate that the study reported the average positive pectoralis power, while filled-in shapes (•, *, ×, +) indicate that the study reported the average net pectoralis power. Dotted lines connect studies which reported both net and positive average power, and solid lines connect data from the same study across different flight speeds. (2) Different methods were used to measure pectoralis power. Star shapes (☆, •) indicate that the aerodynamic force platform (AFP) was used to measure aerodynamic forces (includes the current study), which were used in combination with kinematics to compute muscle power. A filled-in triangle (▴) indicates that differential pressure sensors on the wings were used to compute muscle power. Other shapes (▷,☐, ◇,◦,•, *, ×, +) indicate that some combination of sonomicrometry (sono) to measure muscle length and a strain gauge (limited by high-variance calibrations of muscle stress; Jackson and Dial, 2011a) on the deltopectoral crest (DPC) of the humerus was used to measure muscle force. The plotted shapes refer to the following studies: (1) current study: AFP + kinematics (dove: green): • (net power), ☆ (5-sided-star; positive power; no energy storage), ☆ (6-sided-star; positive power; 100% energy storage). (2) Biewener et al., 1998: Sono + DPC (pigeon: purple): • (net power), ◇(positive power). (3) Tobalske and Biewener, 2008: Sono + DPC (pigeon purple): • (net power), ☐ (positive power). (4) Dial et al., 1997: Sono + kinematics (magpie: turquoise): o (positive power). (5) Tobalske et al., 2003: Sono + DPC with quasi-steady aerodynamics model for calibration (dove: green, cockatiel: yellow-green, magpie: turquoise): * (net power). (6) Soman et al., 2005: Sono + DPC (pigeon: purple): ▷ (positive power). (7) Usherwood et al., 2005: differential pressure sensors on wings (pigeon: purple): ▴ (positive power). (8) Ellerby and Askew, 2007: Sono in vivo + muscle force in vitro (zebra finch: red, budgerigar: orange): × (net power). (9) Jackson and Dial, 2011a: Sono + DPC (jay: gold, magpie: turquoise, crow: blue, raven: pink): + (net power). (10) Ingersoll and Lentink, 2018: AFP + kinematics (Anna’s hummingbird: gray): ☆ (net power; no energy storage), ☆ (6-sided-star; net power; perfect energy storage).
Figure 7—figure supplement 4. By comparing our computed time-resolved power for doves (Figure 4B) to hummingbirds also computed using the aerodynamic force platform in Ingersoll and Lentink, 2018, we find that the aerodynamic power during downstroke is similar, while the aerodynamic power during upstroke and the inertial power are very different.

Figure 7—figure supplement 4.

N = 6 Anna’s hummingbirds, n = 5 wingbeats each, flapping frequency = 41 Hz, N = 4 doves, n = 5 flights each, flapping frequency = 9.8 Hz; second stroke after takeoff for doves and hovering flight for hummingbirds; gray region indicates downstroke for doves; power scaled by bodyweight: bw; vertical dashed lines indicate pectoralis strain rate equals zero for doves. (A) The aerodynamic power scaled by bodyweight is similar during upstroke and downstroke for hummingbirds (gray), whereas for doves (blue), the primary aerodynamic power is during downstroke. (B) The magnitude of the inertial power scaled by bodyweight is significantly larger for hummingbirds (gray) than for doves (green). (C) The required muscle power (aerodynamic + inertial power) scaled by bodyweight is larger for hummingbirds (gray) during the majority of the stroke than for doves (black).