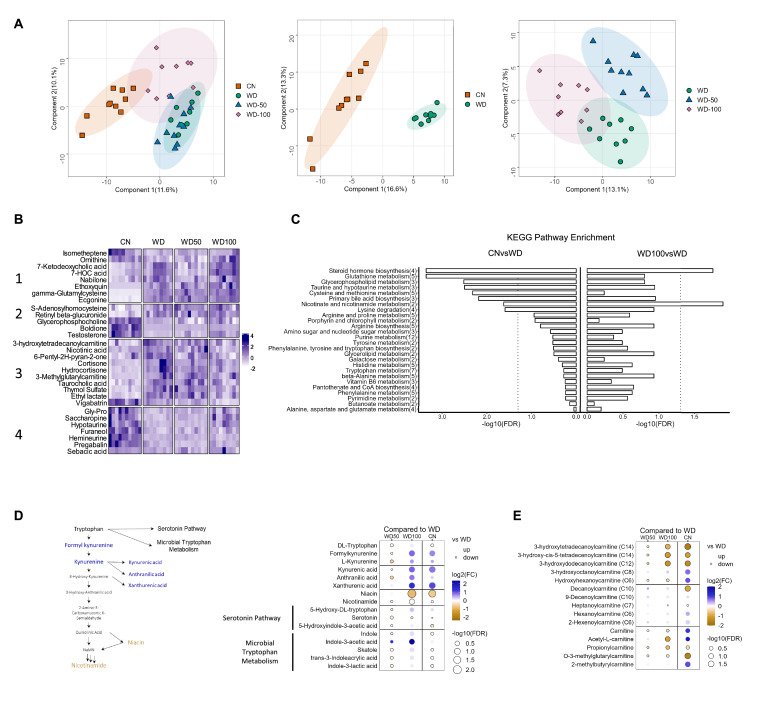
Figure 3. Indole-3-acetate (I3A) administration partially reverses diet-induced metabolome alterations in the liver.
(A) Scatter plots of latent variable projections from PLS-DA of untargeted metabolomics data features. Comparison of all four experimental groups (left panel), control mice (CN) vs. Western diet (WD) group (middle panel), and WD vs. WD-50 and WD-100 groups (right panel). (B) Heatmap of significant metabolite features (FDR<0.1) based on statistical comparisons of treatment groups (CN vs. WD). (C) KEGG pathway enrichment analysis of the metabolites. Number in the parenthesis represents the metabolites detected in the pathway. (D) Schematic for tryptophan metabolism (left panel). Tryptophan metabolism metabolites fold-changes of WD-50, WD-100, CN relative to WD (right panel). (E) Acyl-carnitine fold-change of WD-50, WD-100, CN relative to WD. p-Values were calculated using Student’s t-test and corrected by FDR.


